
To help round out the knowledge of people whose experience in these two areas tends to be a bit lopsided, we've held python classes, a typography lecture, and other small workshops to go over specific skills. As a more formal education effort, Ben Fry has also been teaching an information design class at MIT, now in its third semester and an official part of the D-minor curriculum.
My fellow designer (and co-alum from Wash-U) Paul and I took advantage of a small break between client projects to follow along with a few of the MIT assignments. It was a great opportunity to practice our technical skills and code everything ourselves from the ground up, using the p5.js version of Processing. The first project was to design and build custom apps that would pull weather data from the Dark Sky API. Before diving into any API data, I decided to start with some really basic weather sketches just using Processing. I began with a simple bar graph charting ten years of Boston snowfall totals. (For anyone who missed the record-shattering winter of 2015, here's a photo of a nearly three-story snow pile near Back Bay for reference).
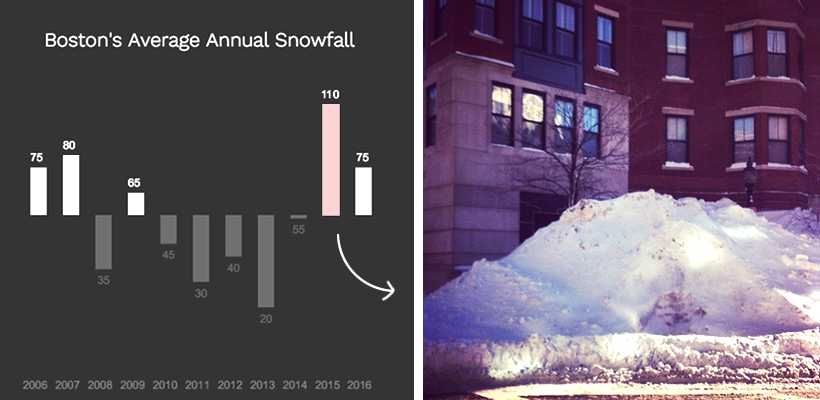
I then built a second sketch that translated the accumulation totals into falling snow, with heavier years translating into larger, increasingly opaque snowflakes. Users could click through all ten years to get a sense of how intense the winter was. The severity of the 110-inch record is reflected nicely in the Processing sketch.
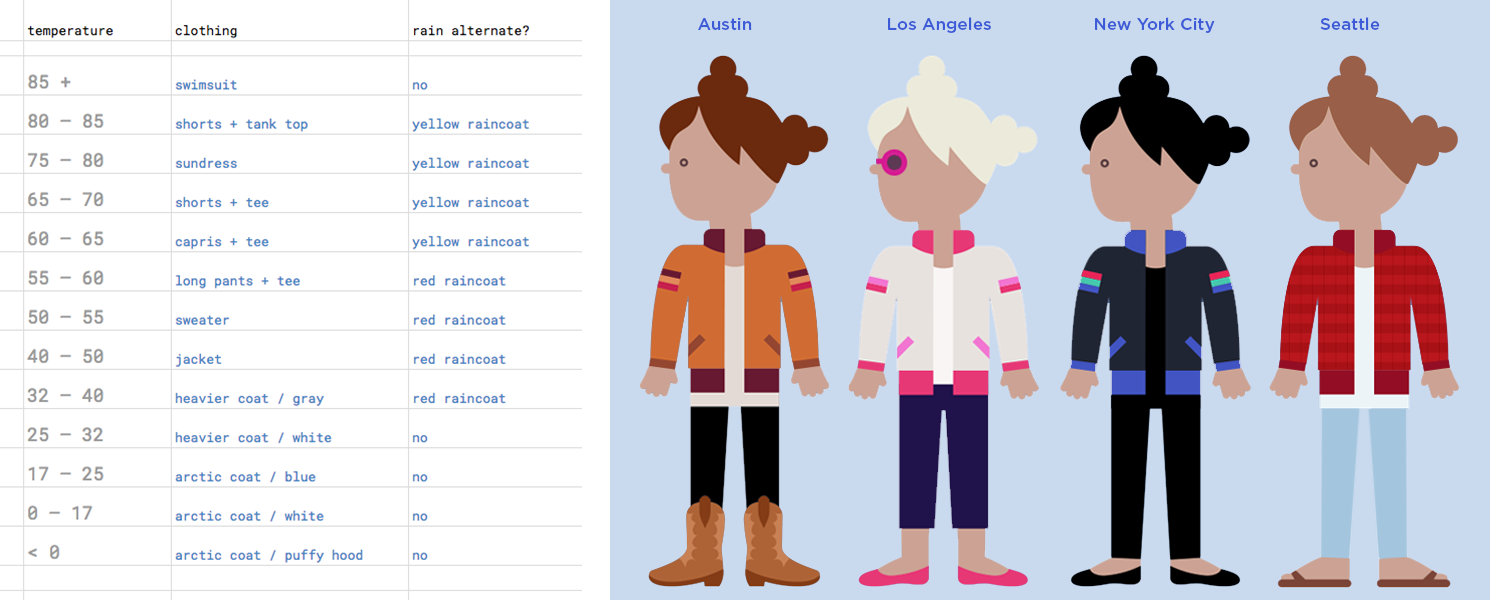
After doing a few smaller studies, I felt ready to attempt working with the weather API. Dark Sky (and many other weather APIs) offer current data on a huge range of specific weather variables. Using a location's geocoordinates, you can easily track several dozen weather stats such as humidity, visibility, windspeed, type and intensity of precipitation, time of sunrise and sunset – and of course, the moon phase. I tried sketching a simple anemometer (the instrument that looks sort of like a weathervane, except that it measures windspeed rather than direction). The rate of rotation in the sketch is based on current windspeed and plugging in coordinates for different cities. Now that I had one metric working, I was ready to build out more features. I had recently created a small arsenal of vector people, so I borrowed one of the girls and built her a wardrobe of outfits that would be selected according to the current forecast.

I then grabbed the latitude and longitude of about two dozen locations scattered all across the globe, and set up a sketch where people could click through and see not only the weather in these places, but also what to wear. I also built rain and snow into the program – these initial sketches were started in the dead of winter, and during several snowstorms in Boston, it was fun to check in and see equally intense weather reflected in the p5.js sketch.
I added an additional layer for extreme cold – as the temperature drops below zero, a transparent white rectangle becomes slowly visible (Note how cold Oslo looks at a bone-chilling minus 23°F).
Once the clothing, ranges, and base list of cities were all set, Charlie and Olivia helped me clean up the code and set up Weather Girls as a website and Chrome extension. We are hoping to eventually add regional clothing features, including a complete set of all black outfits for New Yorkers and a Boston Terrier to accompany our local weather girl. Visit fathom.info/weathergirls for your local weather details as well as current weather conditions all across the globe!
We’d love to hear what you’re working on, what you’re curious about, and what messy data problems we can help you solve. Drop us a line at hello@fathom.info, or you can subscribe to our newsletter for updates.