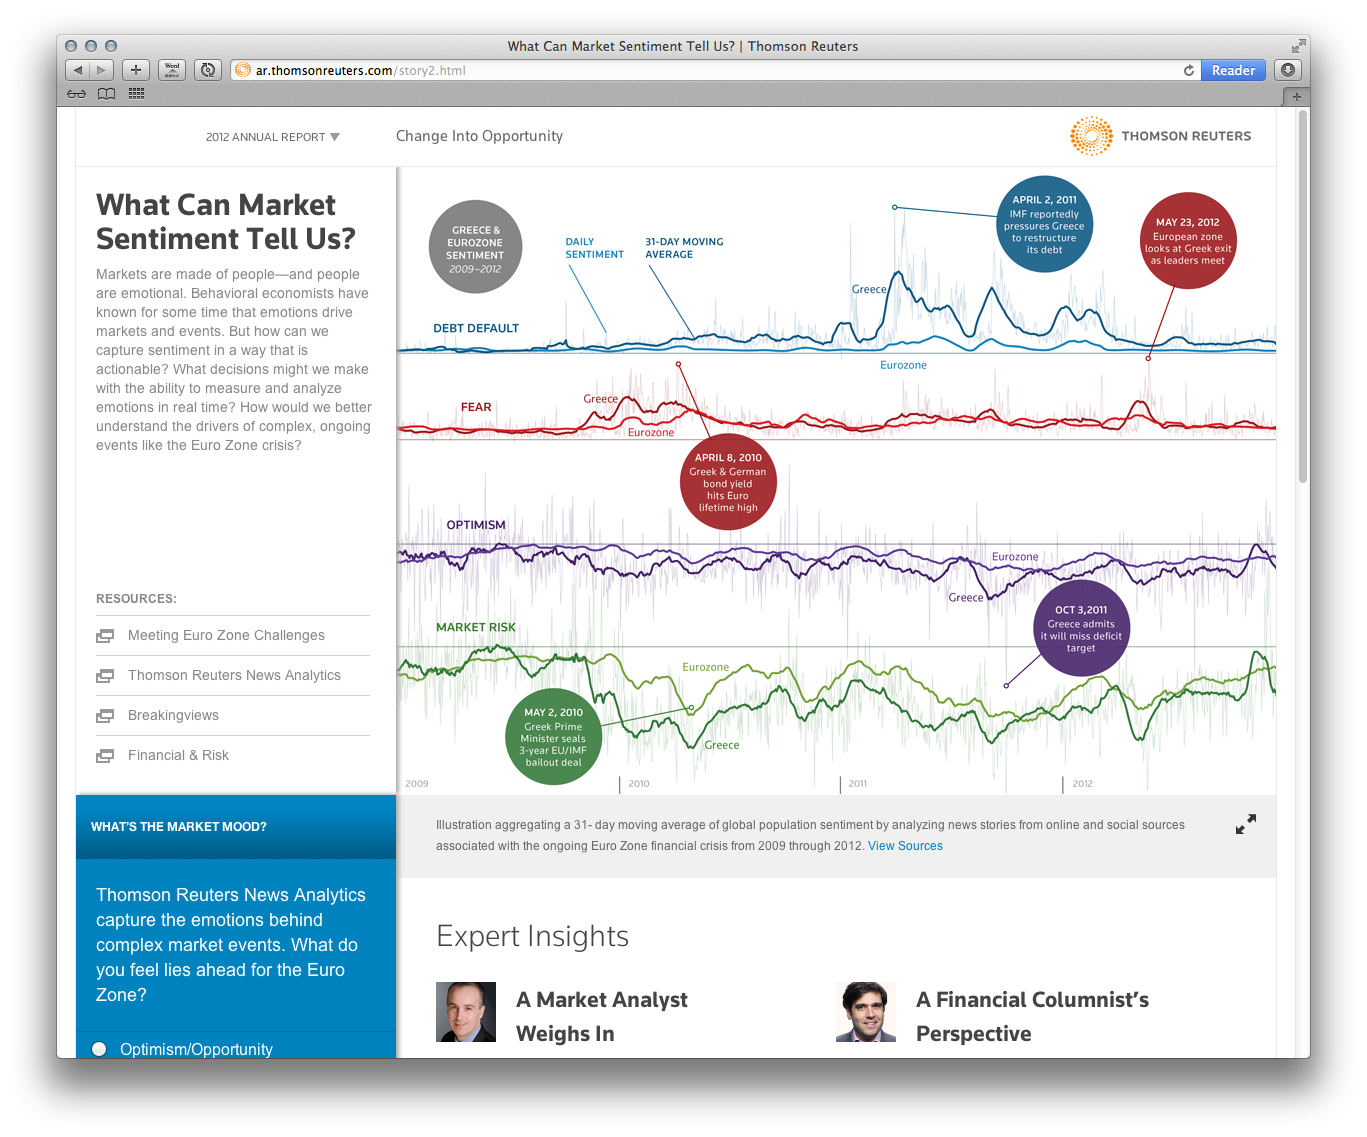
What Can Market Sentiment Tell Us?
We used the MarketPsych Indices, a component of Thomson Reuters News Analytics, to represent the rise and fall of various sentiments across different countries and regions. The indices measure human emotion reflected in news and social media sources; that information can then be used to inform investment and trading decisions.
To begin, we worked through more than one hundred countries and thirty-four types of sentiment, finally deciding to highlight the eurozone financial crisis and the role of Greece within that crisis. (Greece, hard-hit during the global financial crisis of the late 2000s, requested financial aid from the EU and the International Monetary Fund in 2010, which triggered a decline in the value of the euro.) The graphic below compares sentiments about Greece during the financial crisis with sentiments concerning the eurozone in general. By pairing the emotions of fear and optimism with the more concrete concepts of debt default and market risk, we were able to illustrate how opinions about Greece rippled out to other eurozone countries. We annotated specific peaks or dips in sentiment with descriptions of the events that prompted those changes.
A Small Planet Seeks Big Ideas
Environmental and social governance (ESG) policies are a means of measuring “sustainability and ethical impact of investments.” We were asked to investigate the status of such policies from three angles. First, what percentage of corporations worldwide, by sector and by country, adopt these policies? Second, are companies that adopt resource-use policies more likely to report their consumption and emission figures? Lastly, does increased transparency—public reporting of these figures—result in a more efficient use of resources?
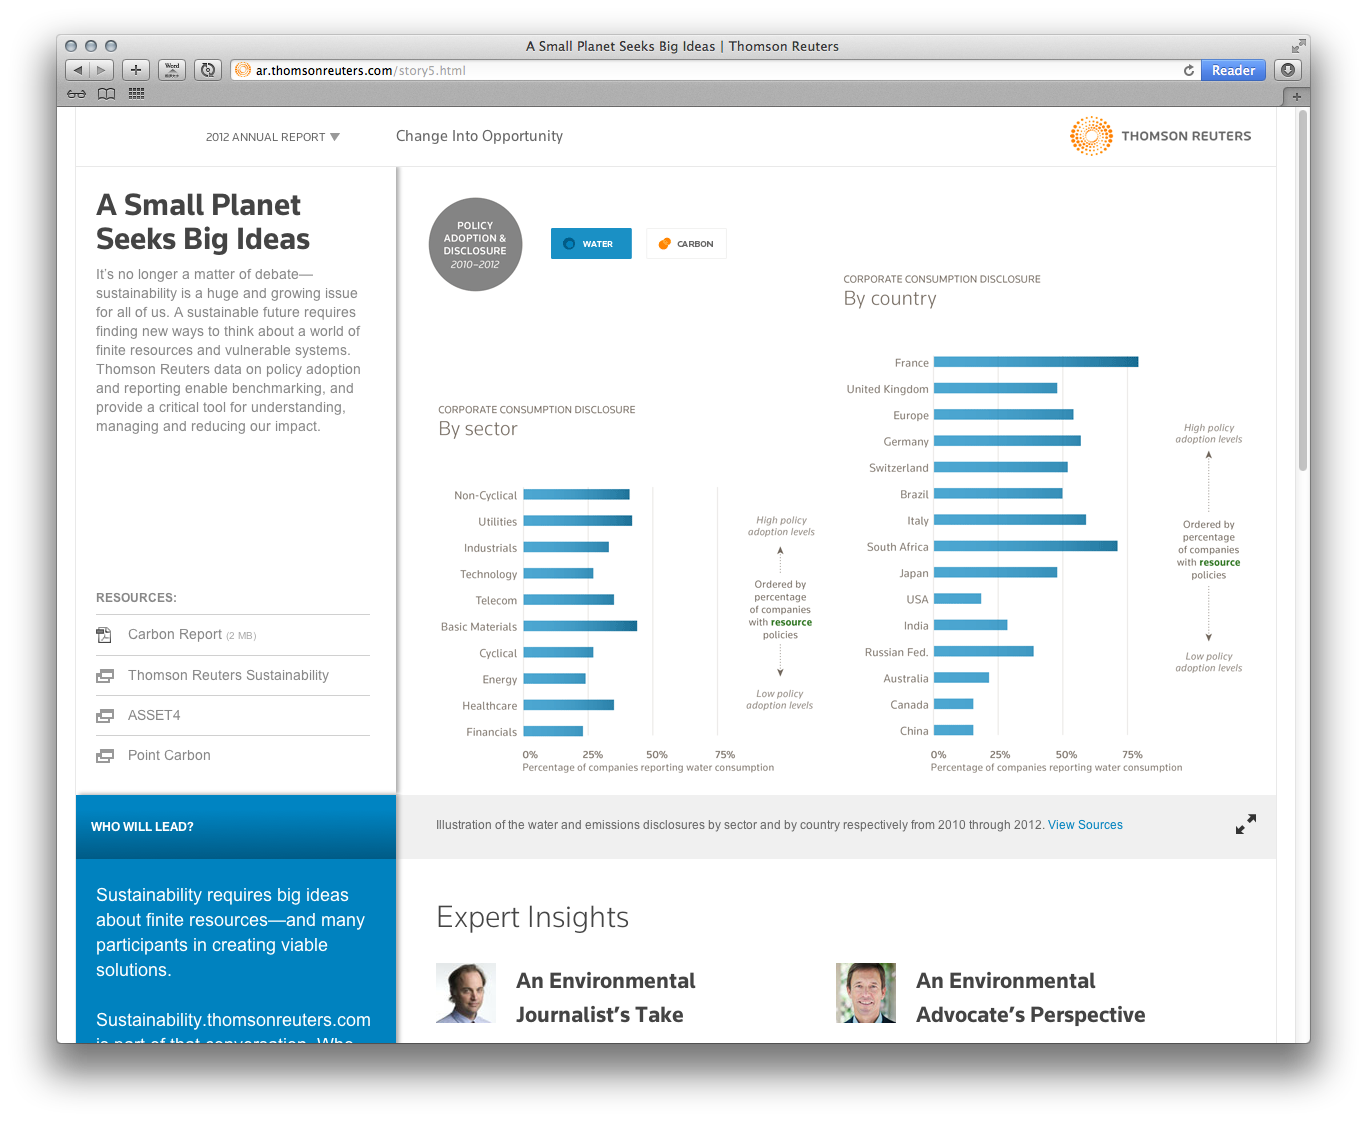
The level of regulation for corporate reporting varies within countries and sectors. Using ASSET4, a curated database of public ESG information, we were able to explore the connection between resource policy adoption and the level of reporting for corporations around the world. We found that companies with resource-use policies in place were also more likely to make their consumption and emission figures public.
We asked our contact at ASSET4 to share his insight on the third question—whether increased transparency could be correlated to more efficient consumption and emissions. His response was something along the lines of, “If I could answer that...I'd be sipping cocktails on a beach right now.” We may not have the million-dollar answer yet, but we’re hopeful for the day when that correlation can be made (if not for environmental reasons, then at least so we can mix drinks with our friends at ASSET4).
High Cost and Pace Drive Collaborative Science
The structure of academic funding, as well as the rise of communications technology, has fueled dramatic shifts in the academic publishing landscape. We explored these shifts using the Web of Knowledge, a database of academic publishing that contains rich metadata about authors, locations, and funding sources for each project.
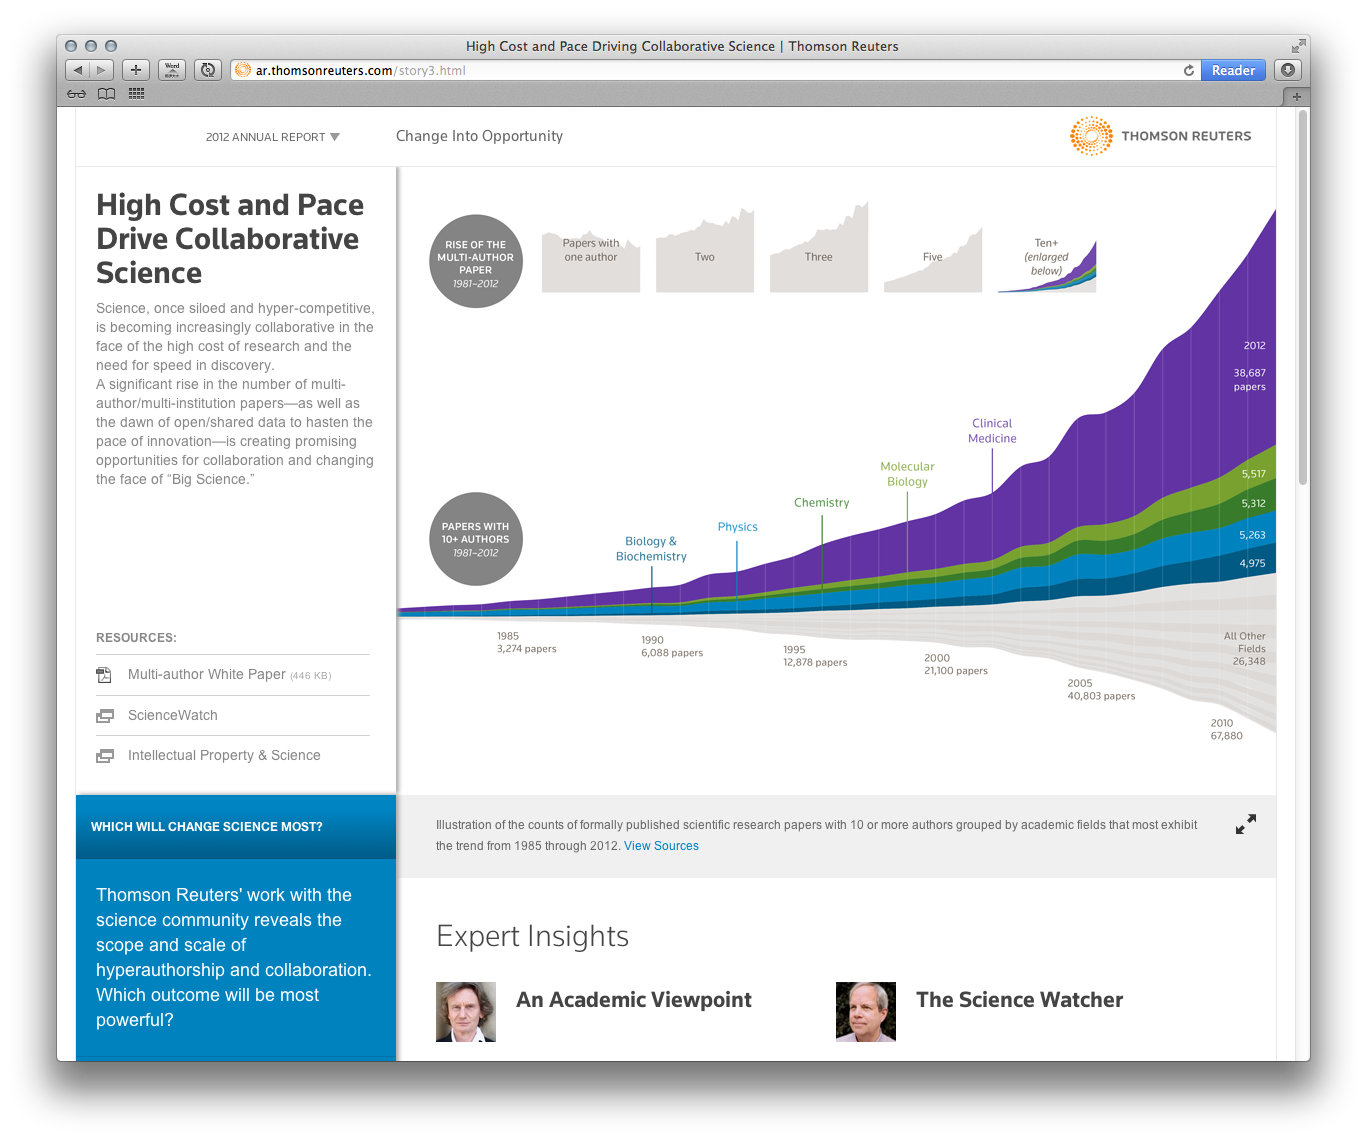
We began by looking at the distribution of author counts for papers across academic fields. We were surprised to find that single-author papers are actually in decline, and the growth of two- and three-author papers (depicted in the gray plots along the top) is slower than that of papers with more authors. The larger image focuses on the rapidly expanding slice of papers with ten or more authors, both highlighting their increasing frequency and which academic fields are fueling the trend. While much of the popular discussion about collaboration centers around fields like physics, where we've heard a great deal about large teams and even larger equipment, the data also revealed that clinical medicine has consistently led the progression toward multi-author research.
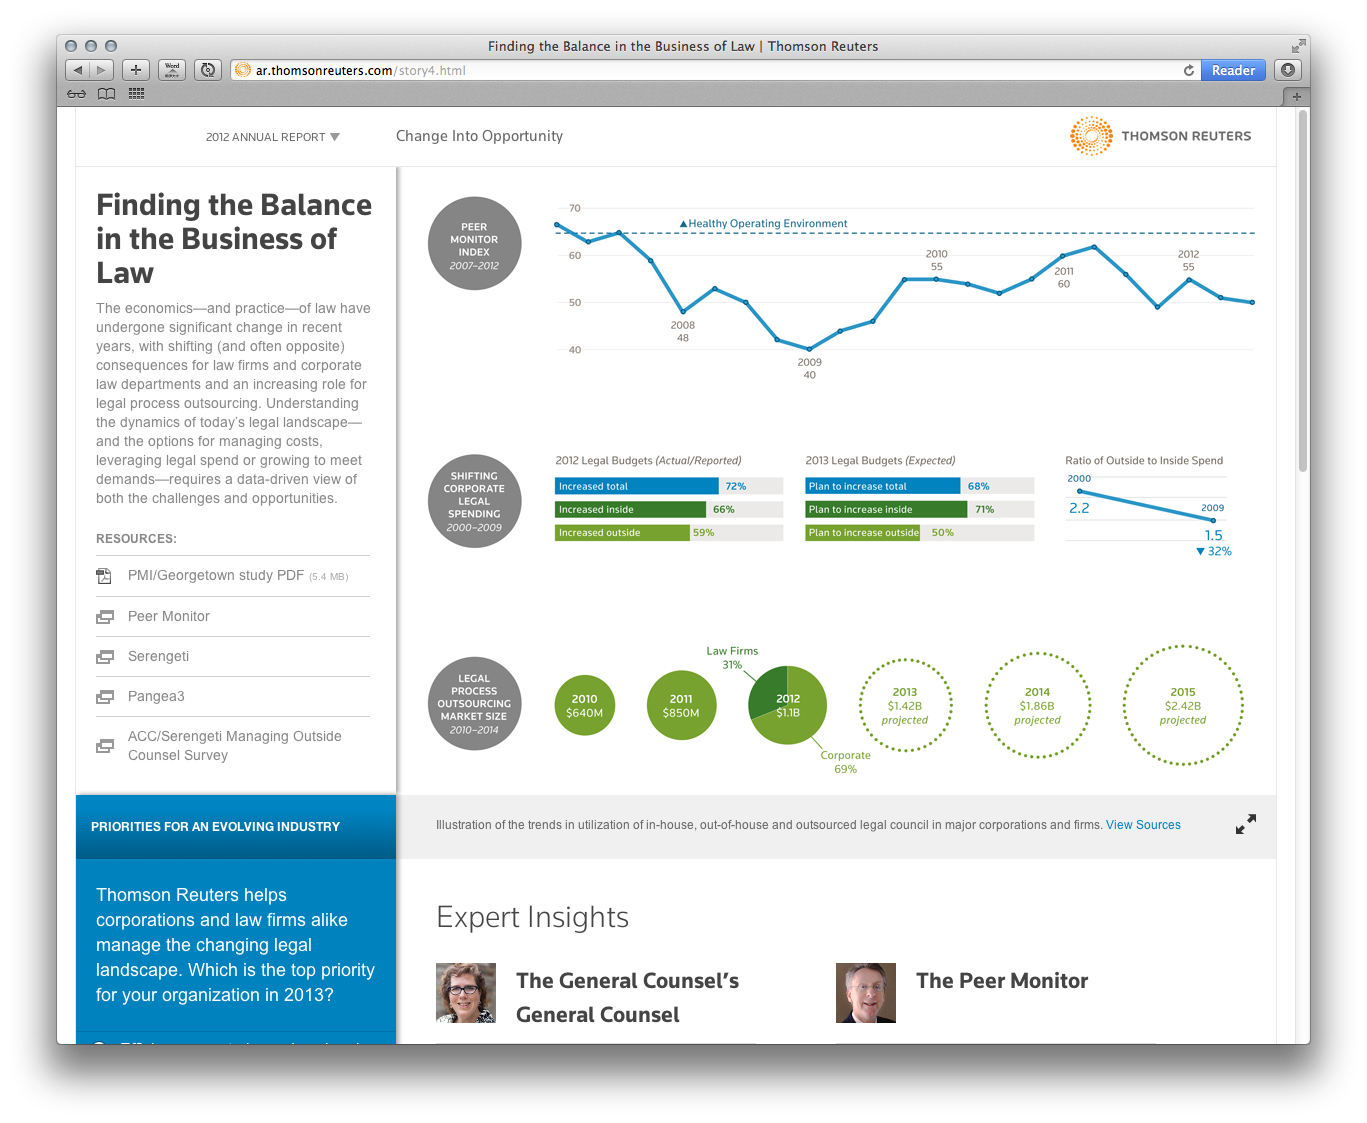
Finding the Balance in the Business of Law
The Peer Monitor Index (PMI), a quarterly indicator of trends in the legal field, is a proprietary metric derived from an annual survey of legal firms and corporate counsel departments. The index is calculated from a set of weighted measurements of the rates, direct expenses, overhead expenses, demand, and productivity reported by survey respondents. With a rise in direct and overhead expenses and a decline in demand and in-house productivity, the PMI has dropped below healthy operating levels since the second quarter of 2007.
We wanted to show how legal entities are addressing changes to the their field. In order to add context to the PMI metric, we incorporated survey data from the Association of Corporate Counsel. This data suggests that legal firms are turning to legal process outsourcing (LPO) to cut overhead costs and raise productivity.
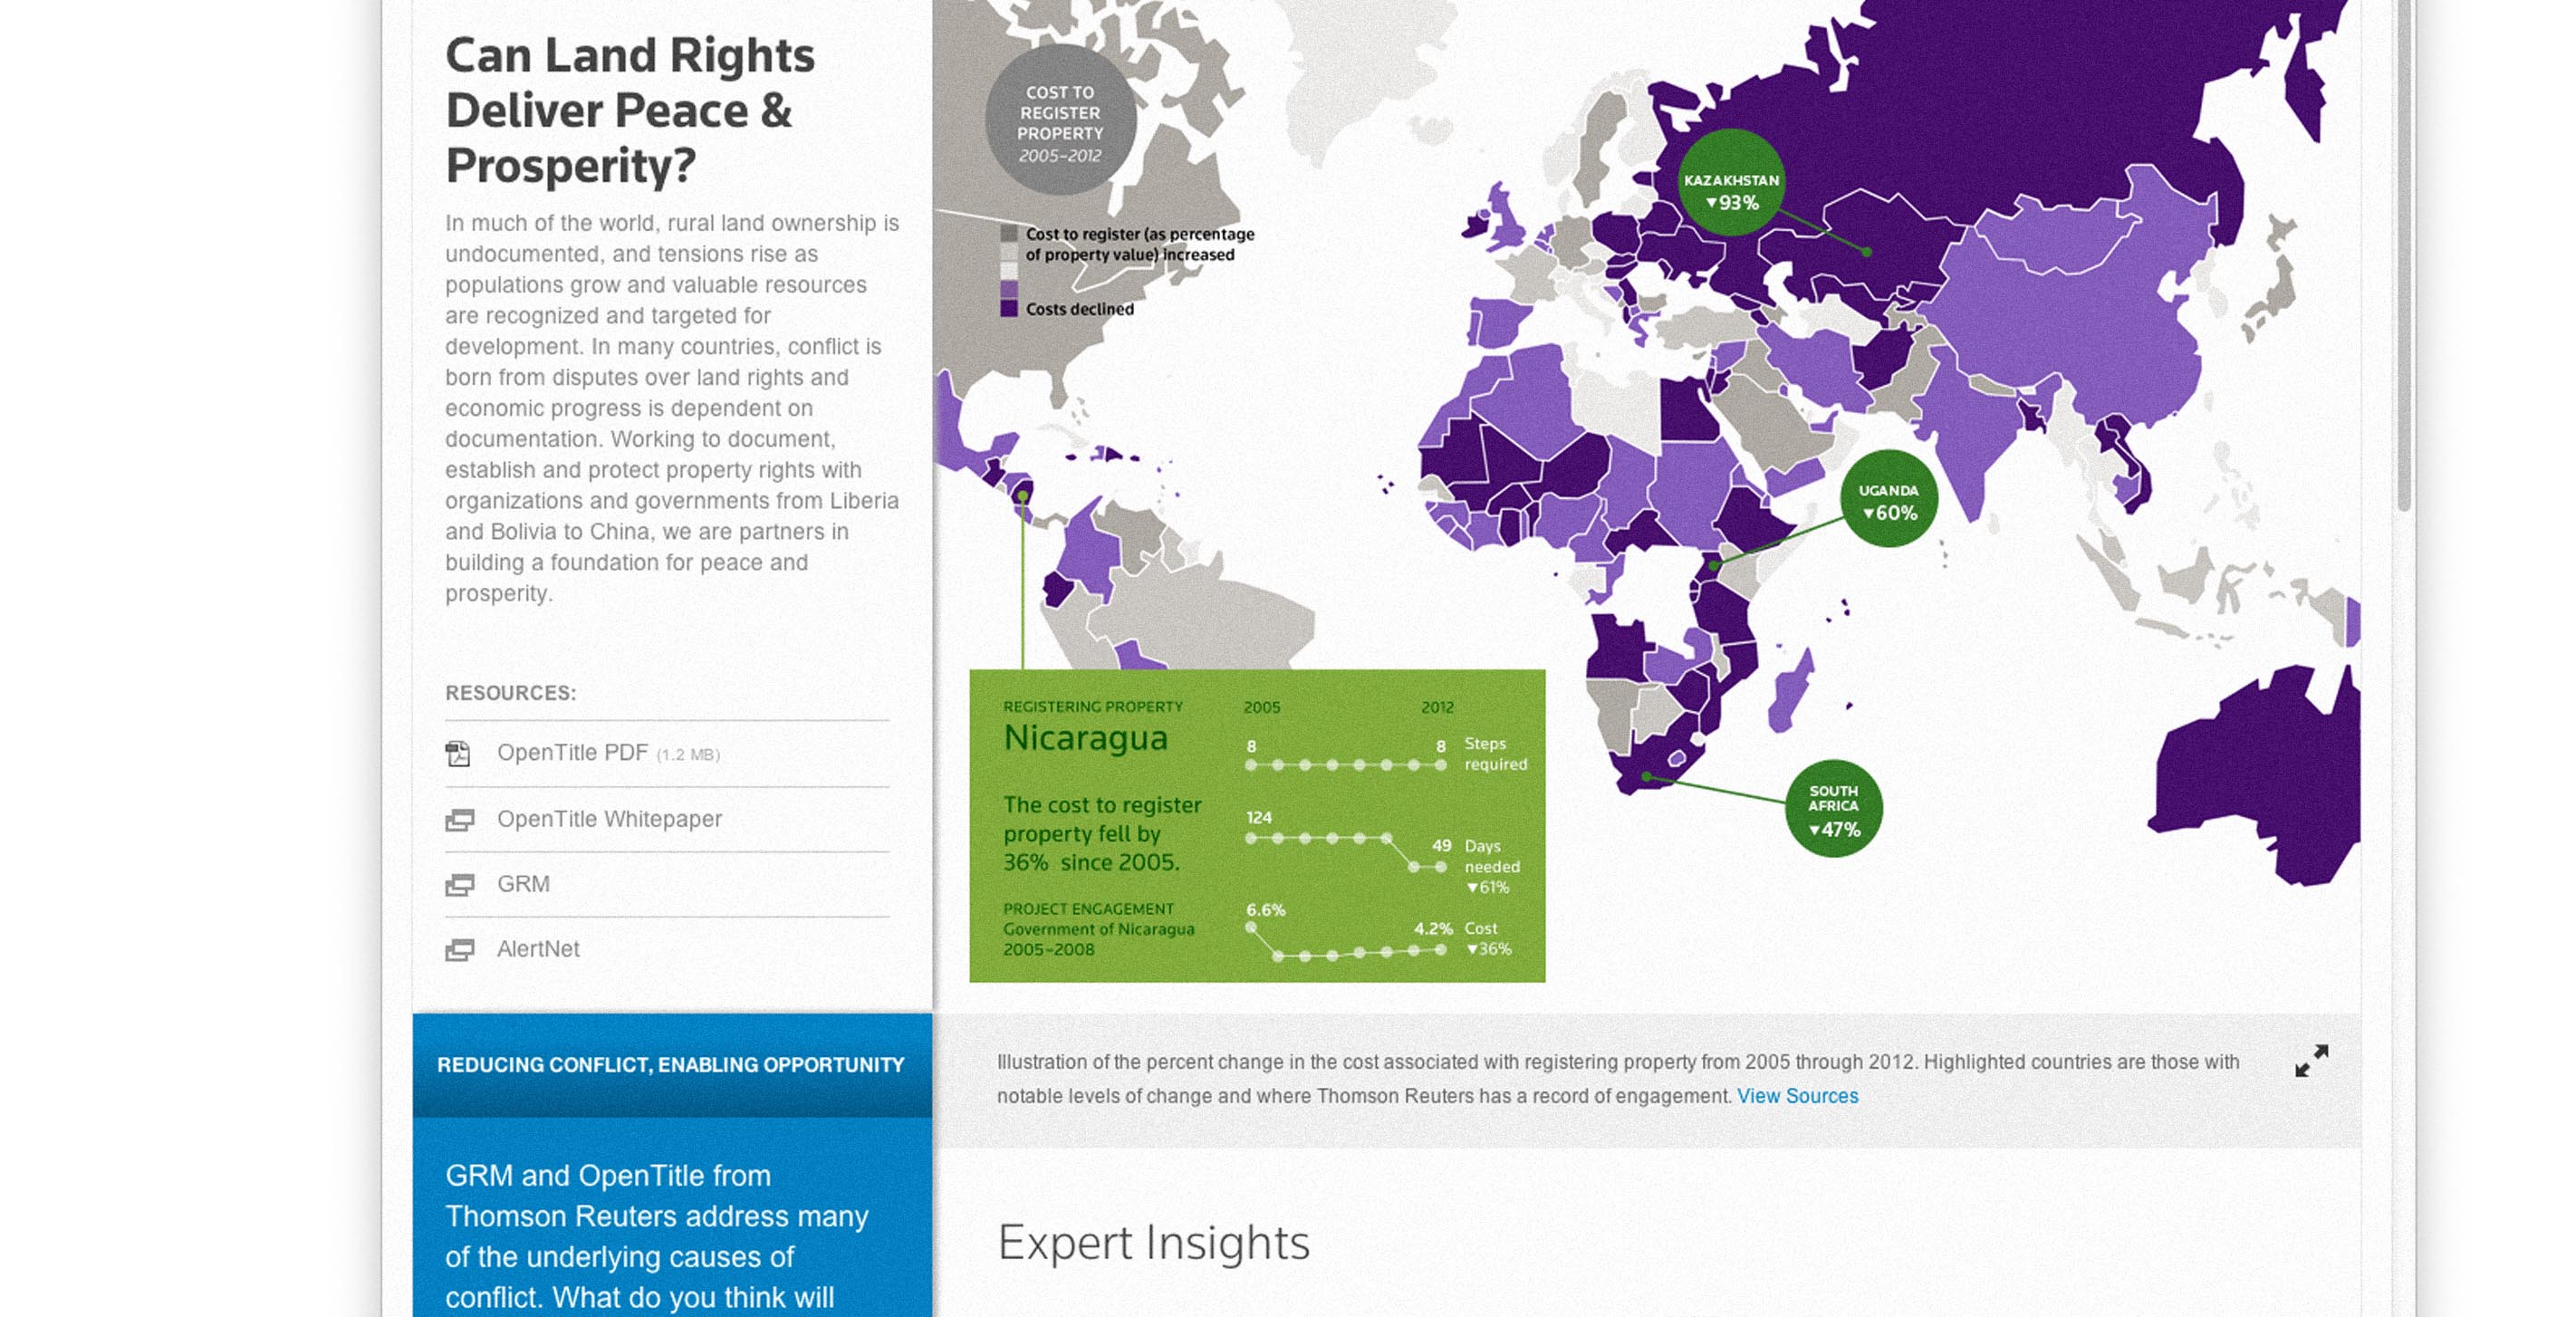
Can Land Rights Deliver Peace & Prosperity?
In developing nations, documenting and protecting land rights is a challenging but essential element of the formula for economic growth and social stability. Hoping to promote the maintenance of more accurate records of land ownership, Thomson Reuters has worked with local governments in some of these countries to implement their land management platform, OpenTitle.
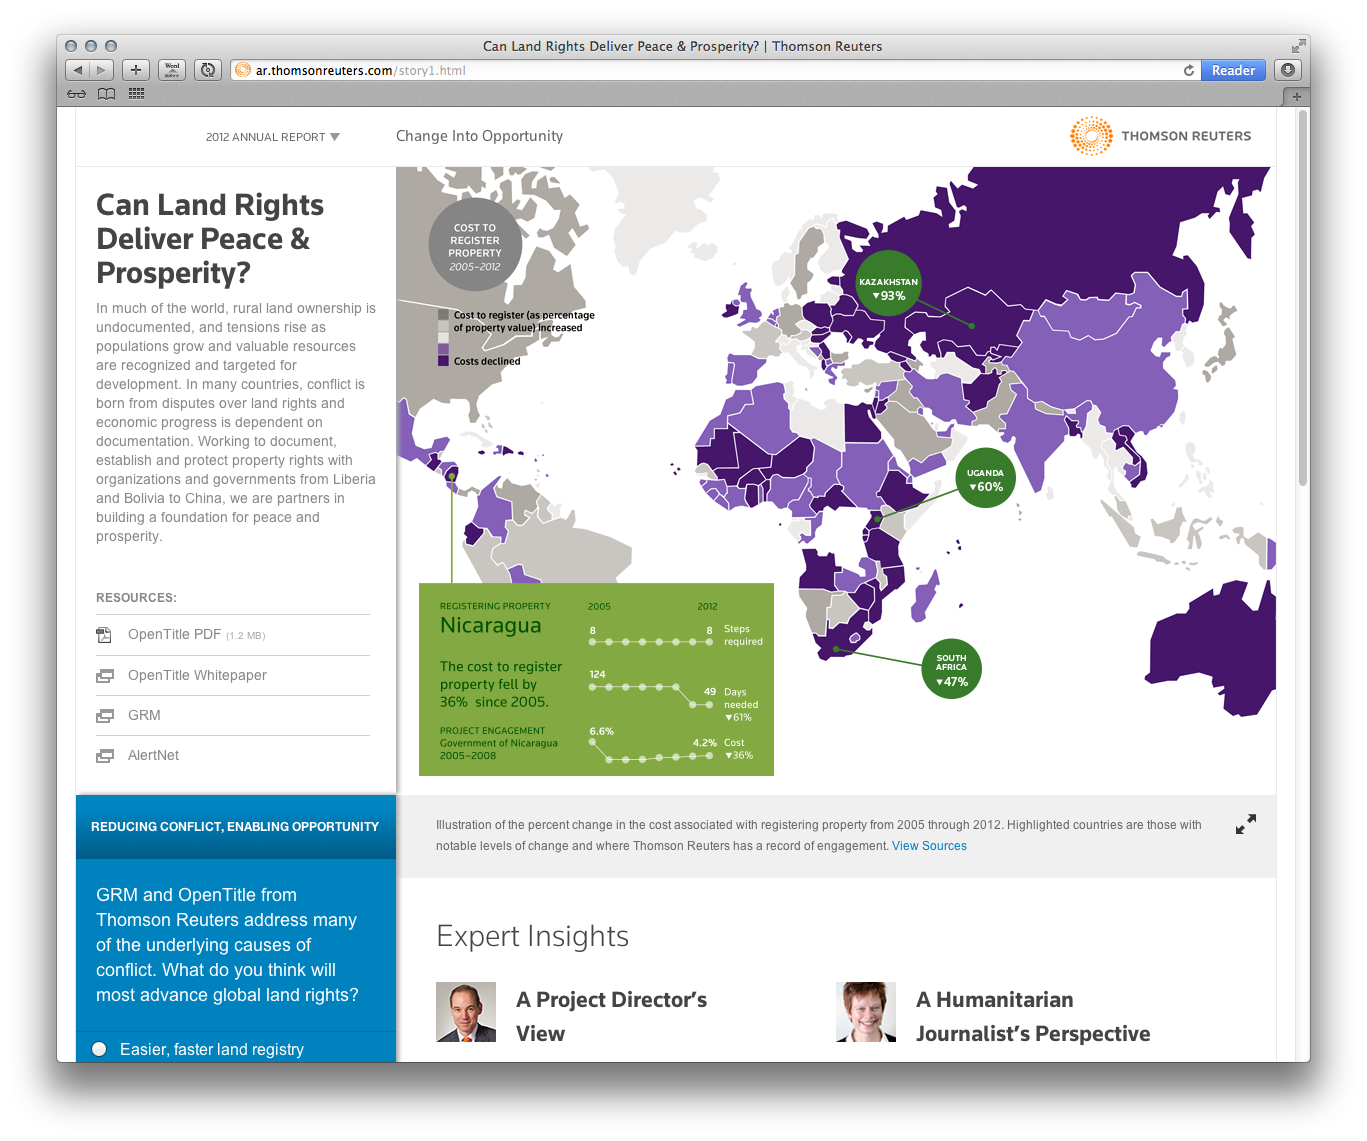
In order to show land rights from a global perspective, we turned to publicly available data from The World Bank, which collects (among many things) global metrics on land rights. To see where conditions were improving, we mapped the cost, length of time, and the number of steps required to register property in each country since 2005. According to the data, the ease of ownership has improved the most in developing nations. Dark purple indicates where the cost of registering land has decreased in the last seven years. Callouts highlight nations where OpenTitle is used.
We’d love to hear what you’re working on, what you’re curious about, and what messy data problems we can help you solve. Drop us a line at hello@fathom.info, or you can subscribe to our newsletter for updates.