You may have heard the buzz already about our biggest release of the fall — an exciting new application called Laniakea. Laniakea is the final in a series of projects created for an 18-month grant we received to research, design, and develop tools that analyze large document sets. In Laniakea, thousands of documents are mapped by their content–not by spotty metadata The tool promotes serendipitous exploration. It focuses not on the ability to search for specific, individual documents, but rather, it provides a comprehensive overview of a full document set, highlighting which topics are present throughout, and how those topics overlap and relate to each other. Currently, you can explore 3 different corpora: 100,000 PubMed articles, 37,552 Wikipedia articles, and the subset of all Wikipedia articles that mention the word ‘ghost’ or ‘ghosts.’
Another release that we’re proud of this fall is Anisha’s blog post on inequality in Boston. Working with a decade of data from the American Community Survey, Anisha put together a data-driven story illuminating a dramatic — and disheartening — pattern of growing inequality in the Boston metro area. The tool she built to explore this data allows users to view the median household income of different Boston neighborhoods for each year. It highlights the striking contrast between areas that have seen an enormous recent increase in wealth — like Seaport — sitting directly adjacent to some of the most disadvantaged neighborhoods, like South Boston.
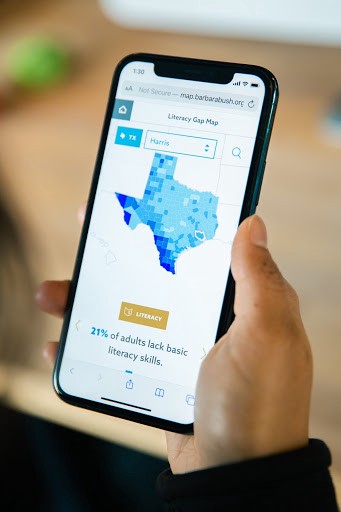
In our last update, we introduced a project that we completed this past summer with the Barbara Bush Foundation for Family Literacy. The project focused on adult literacy in the United States and socioeconomic factors that correlate with literacy, or rather, illiteracy. We built a site for the Foundation that includes a map tool detailing various socioeconomic indicators for every county in the US, which is now available through the Barbara Bush Foundation site. The Foundation released the project in mid-November at their National Summit on Adult Literacy, where Ben presented our work and findings to the summit attendees.
Around the Office
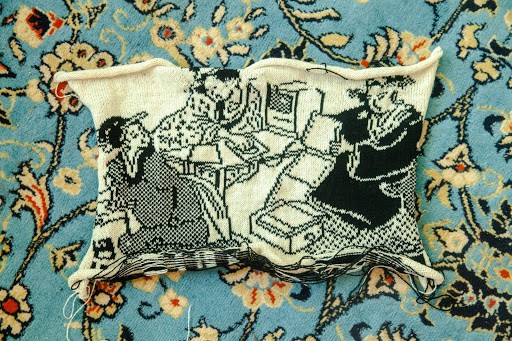
- Our knitting machine has received some major upgrades recently. It can now knit up to 5 colors at a time, and it’s even easier to load in unique patterns for generative knitting. Above, you can see a super cool piece that Olivia made using pixelated clip art as inspiration.
- In October, Ben presented at the Design Thinkers conference in Toronto.
- We always enjoy sharing our work with students. This fall, we presented some recent projects to a data journalism class from Emerson College, and a data visualization course at Harvard.
- We’re hiring! We’d love to hear from designers, writers, and project managers who are interested in joining our team.
We’d love to hear what you’re working on, what you’re curious about, and what messy data problems we can help you solve. Drop us a line at hello@fathom.info, or you can subscribe to our newsletter for updates.