We’ve been building tools to answer this question, but as a short detour, we created a version in print format. You can see it here. We’ve also made the poster available for purchase. As of 2022, we no longer sell our posters online, but office visitors may get a special goodie bag… Below, we talk a bit about the process—why we created it and what else we tried along the way.

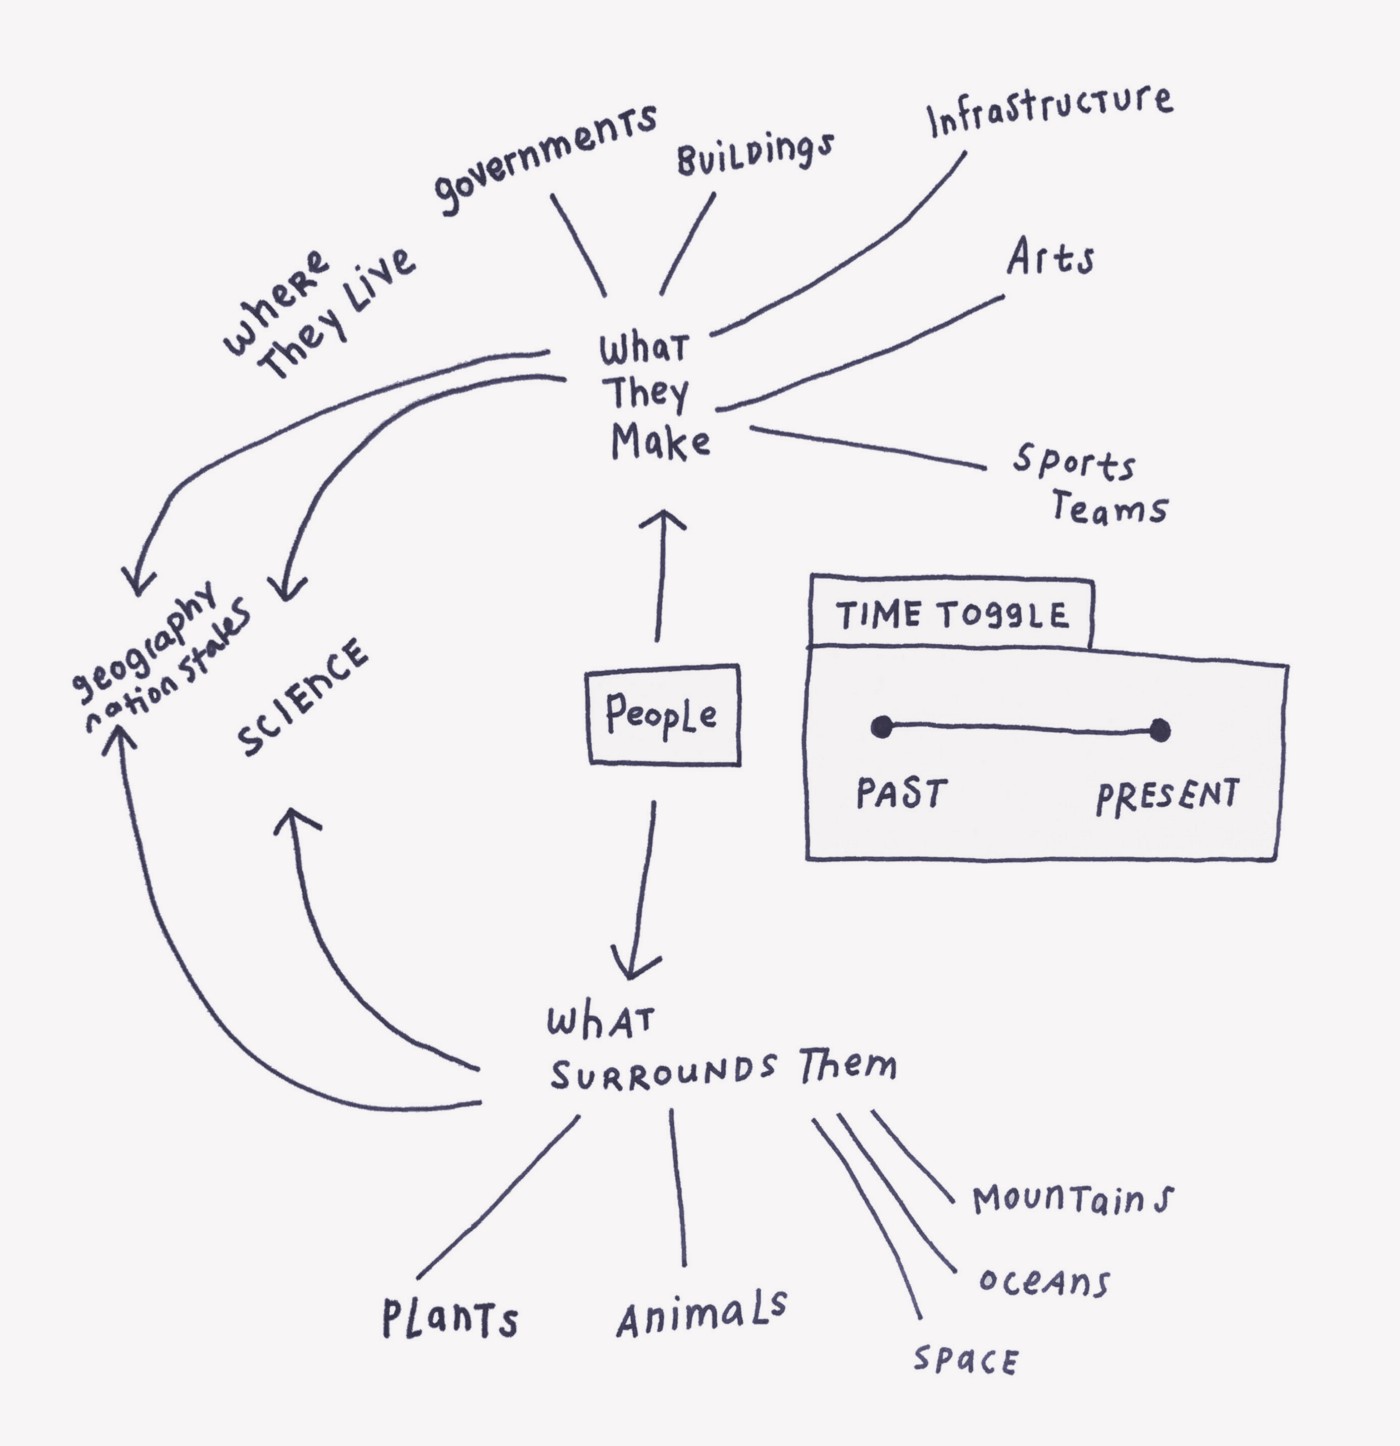
Our initial work in this area revolved around several iterations of interactive tools that provide users with a means to navigate through topics and subtopics for a large document set. While this was really comprehensive and interesting to explore, this version missed some of Wikipedia’s inherent quirkiness.
We’re still developing this tool further, but we wanted to take a detour in a very different direction: how might a hand-drawn version of this map work? No doubt it could bring back some of the variety that makes Wikipedia so interesting, but in the long run, what else might it teach us about how to re-approach the interactive version of such a tool?

Encyclopedias have existed in some form for the past two thousand years, but free and openly editable collections such as Wikipedia have vastly increased the scale of what is written about, as well as the range of people writing.
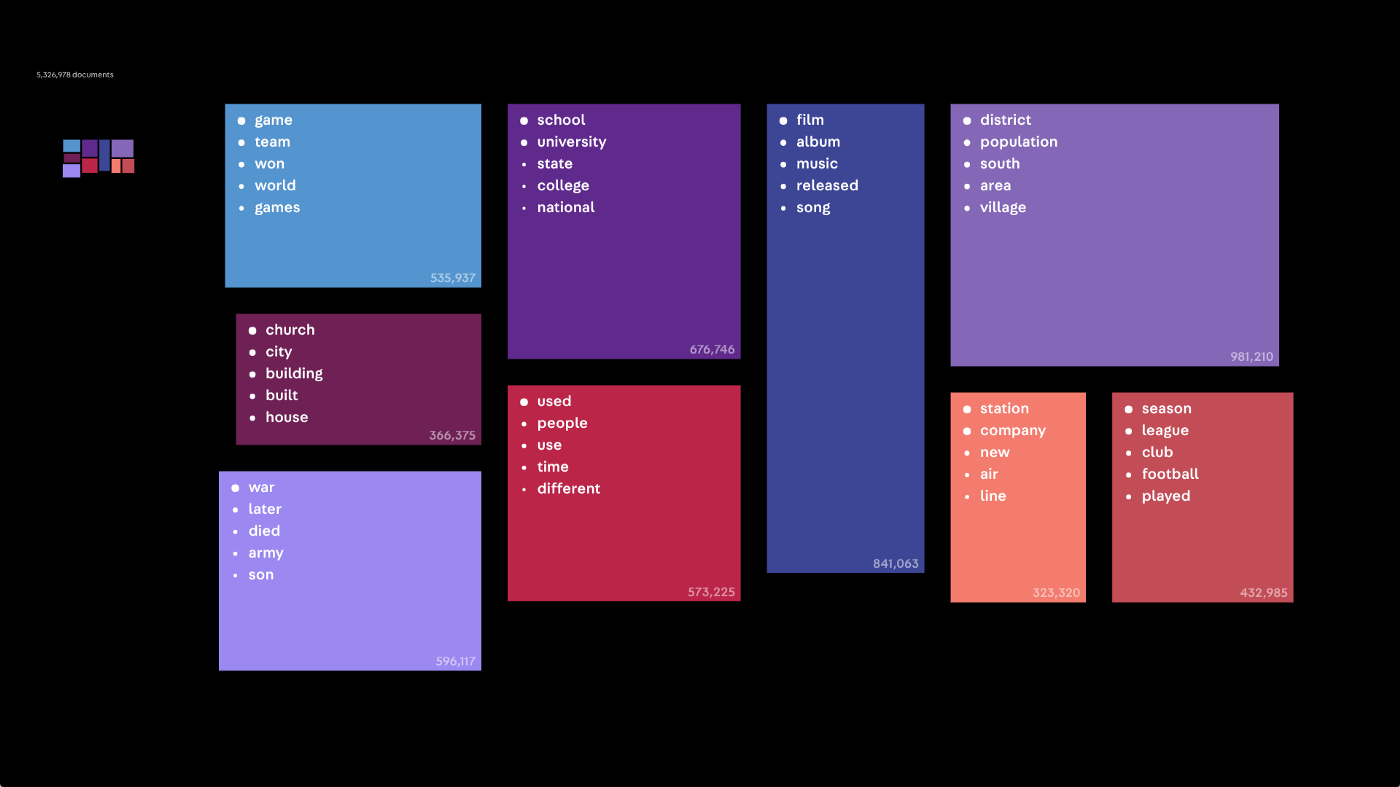
There are about 5½ million English language articles alone (while this is the biggest individual group, there are 291 other Wikipedias written in other languages). We used topic modeling algorithms to analyze the text of each individual article. Each of the articles were sorted first into eleven topics before being sub-divided again into eleven subtopics.

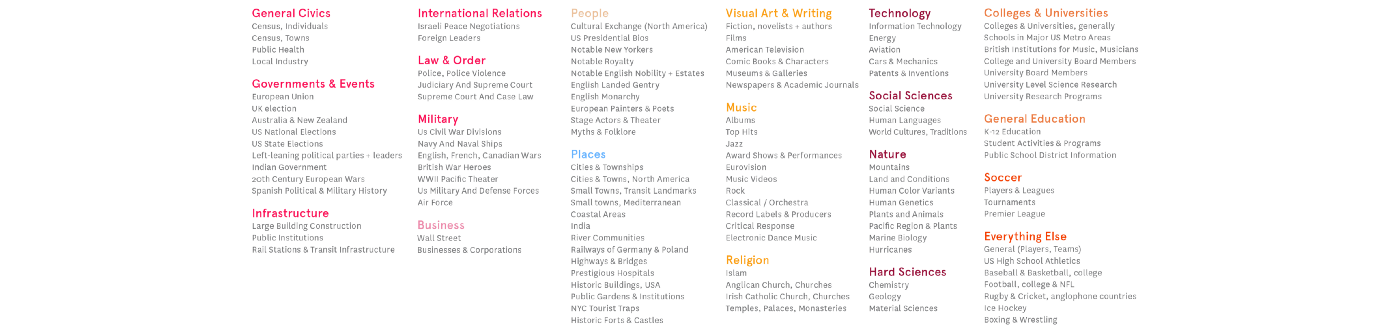
Each group of subtopics was comprised of about twenty key words, generated from the most common recurring phrases within that group of articles. We then evaluated the computer-generated clusters to consider what to merge and how to manually improve the categorizations based on lists that were clearly covering similar themes.
In some instances, subtopics shared overlapping terms with neighboring clusters, but each had enough variation to be distinctly classified (so for example, military-themed lists could be sorted into groups like ‘Air Force’, ‘Navy’, and ‘Military Heroes’). Some groups were easier to categorize than others, but ultimately we ended up with a fairly clear, proportional breakdown of all the different subjects Wikipedia’s authors write about (and editors see fit to keep).

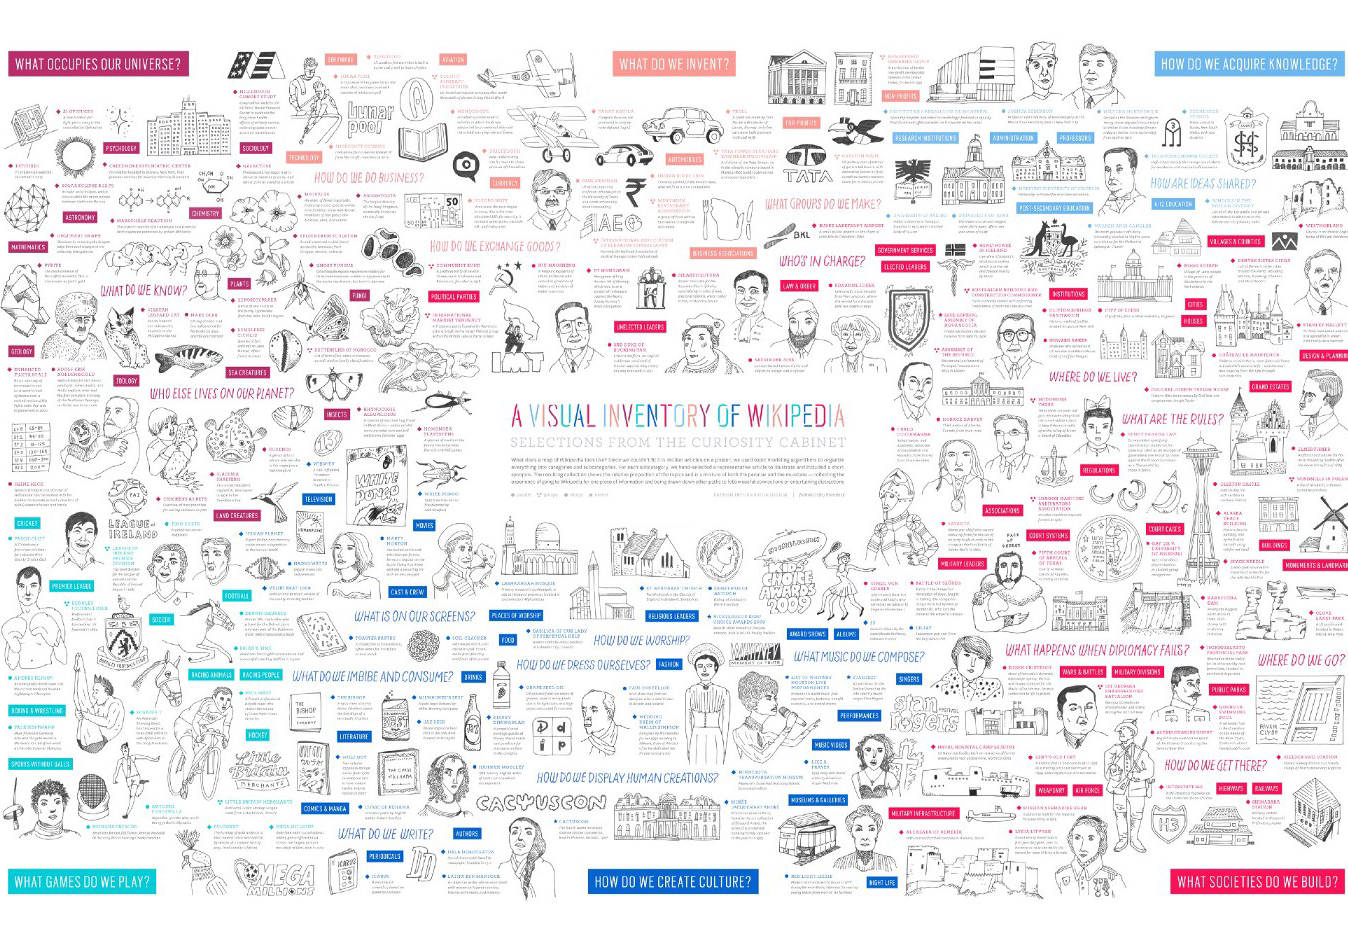
Each of the subtopics also came with a set of links to Wikipedia articles from within that group. We chose at least one article from each of these groups to illustrate, building an eclectic collection of topics that together formed a small but proportional look at the entire database of articles. Since this is just a sampling of the Wikipedia articles pulled from the topic modeling results, the poster could be theoretically repeated thousands of times, with different results each time. The structure would remain the same, but the specific article choices each time showing a new core sample of the entire archive.
The illustrations represent single articles selected from each subcategory, depicting the mixture of idiosyncratic and mundane found in this record of human interests and accomplishments.
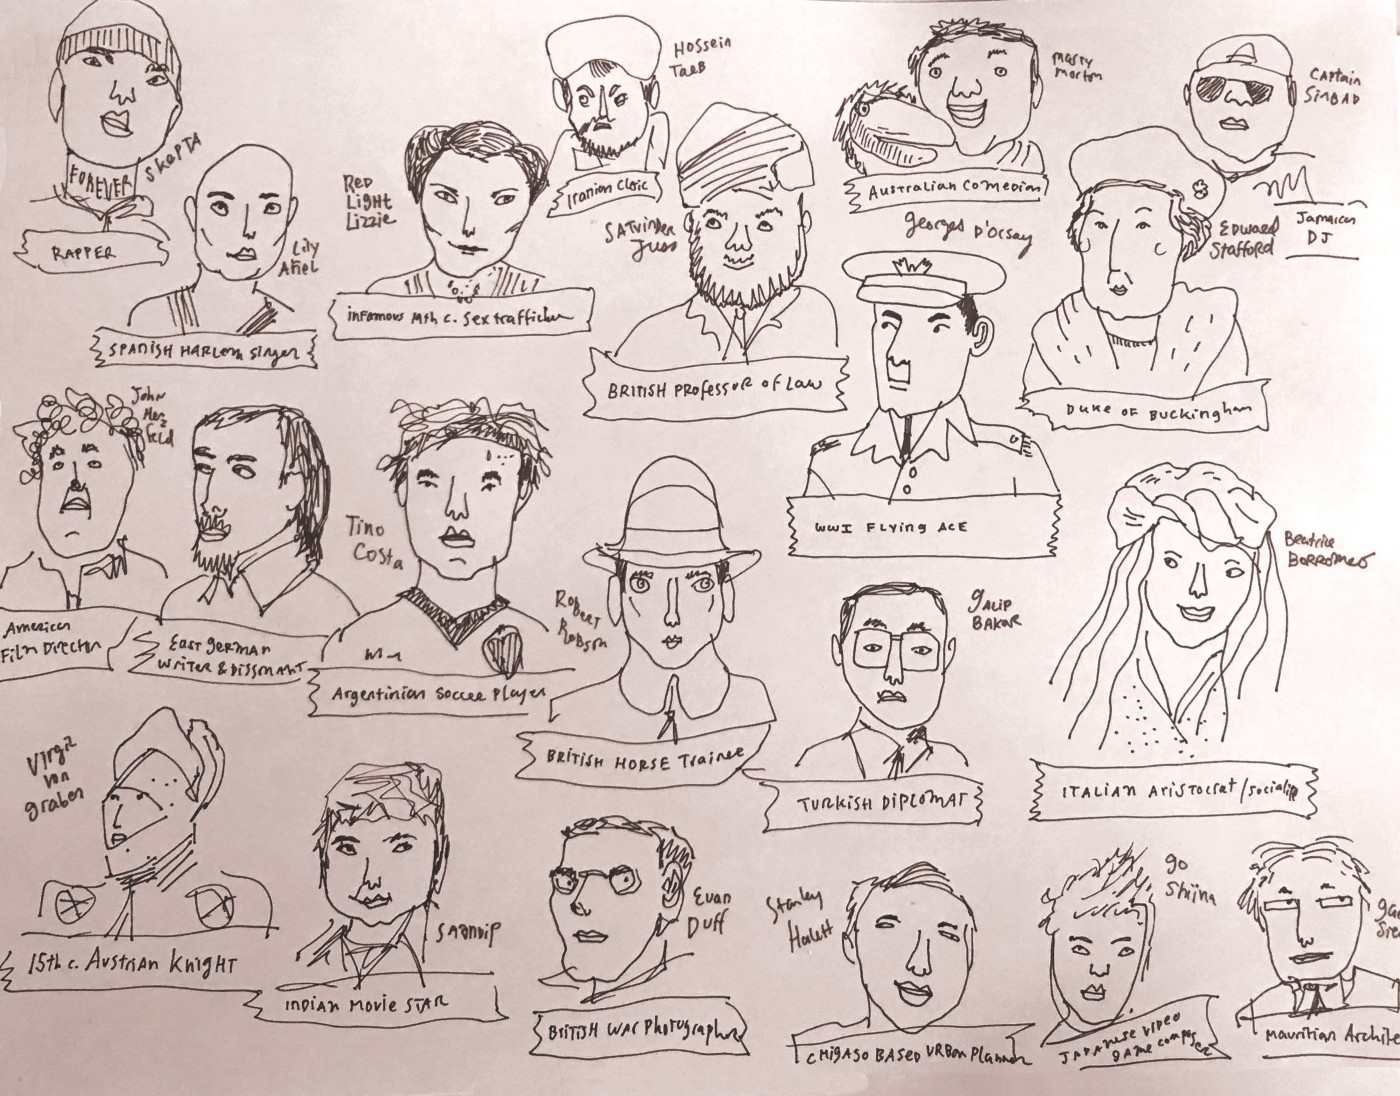
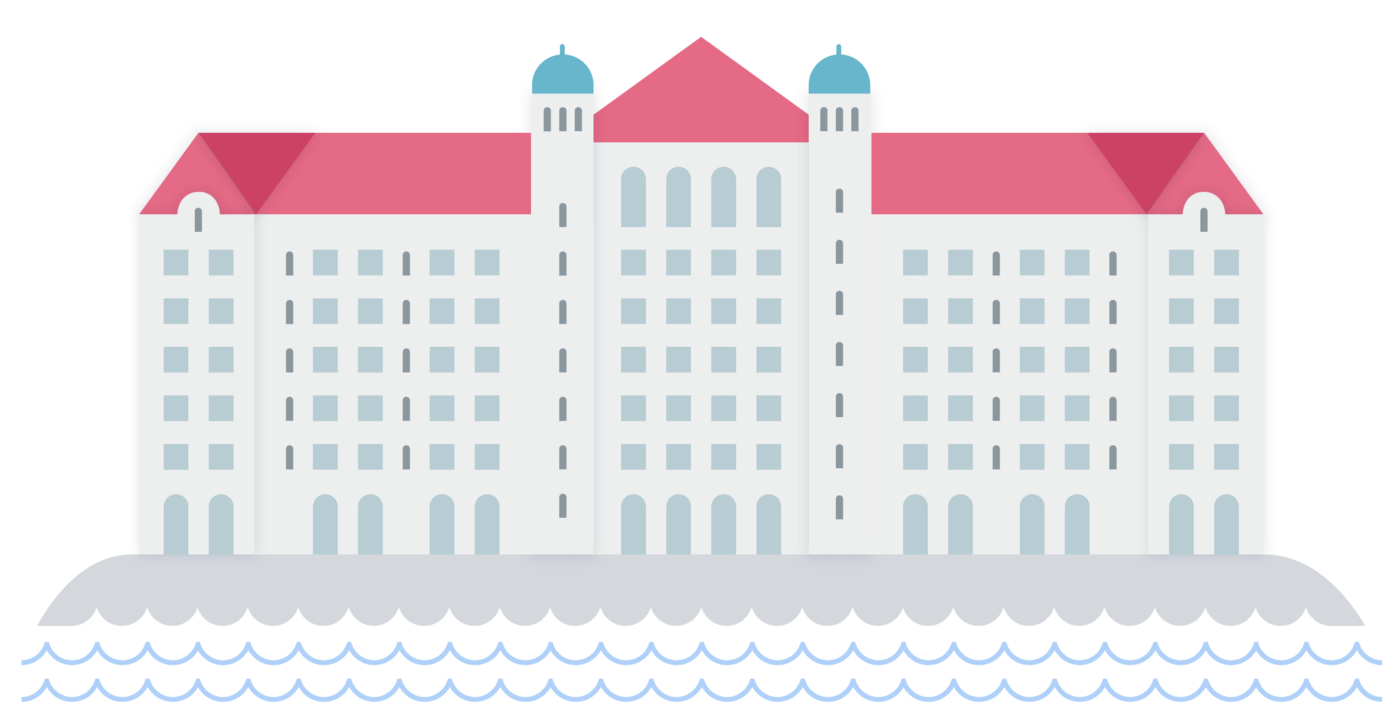
In the early sketching stages, Rachel created rough sketches of portraits as well as trying out a vector image style. While some of the institutions and buildings looked especially sharp in the latter style, the approach felt too tight, and ultimately, would be too labor-intensive to render over 200 illustrations in this fashion.
The final poster shows the proportion of various categories of articles found on Wikipedia, while also mixing in some of its character with small illustrations and short synopses of representative articles.
You can see the full version with more detail here, though it hardly compares to seeing it in person.
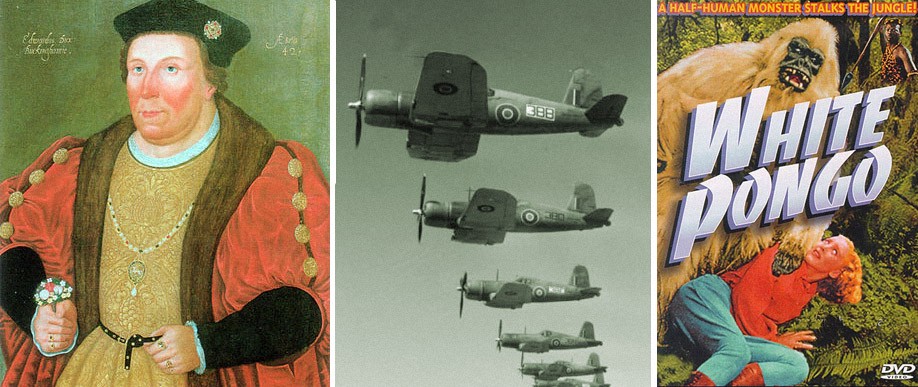
There were some really wonderful reference images gathered along the way, many of which are re-created in the final poster. Articles didn’t all have images and the quality was too inconsistent for us to use them for the poster, but we amassed a fantastic collection. Fodder for another experiment and another day.
We’d love to hear what you’re working on, what you’re curious about, and what messy data problems we can help you solve. Drop us a line at hello@fathom.info, or you can subscribe to our newsletter for updates.