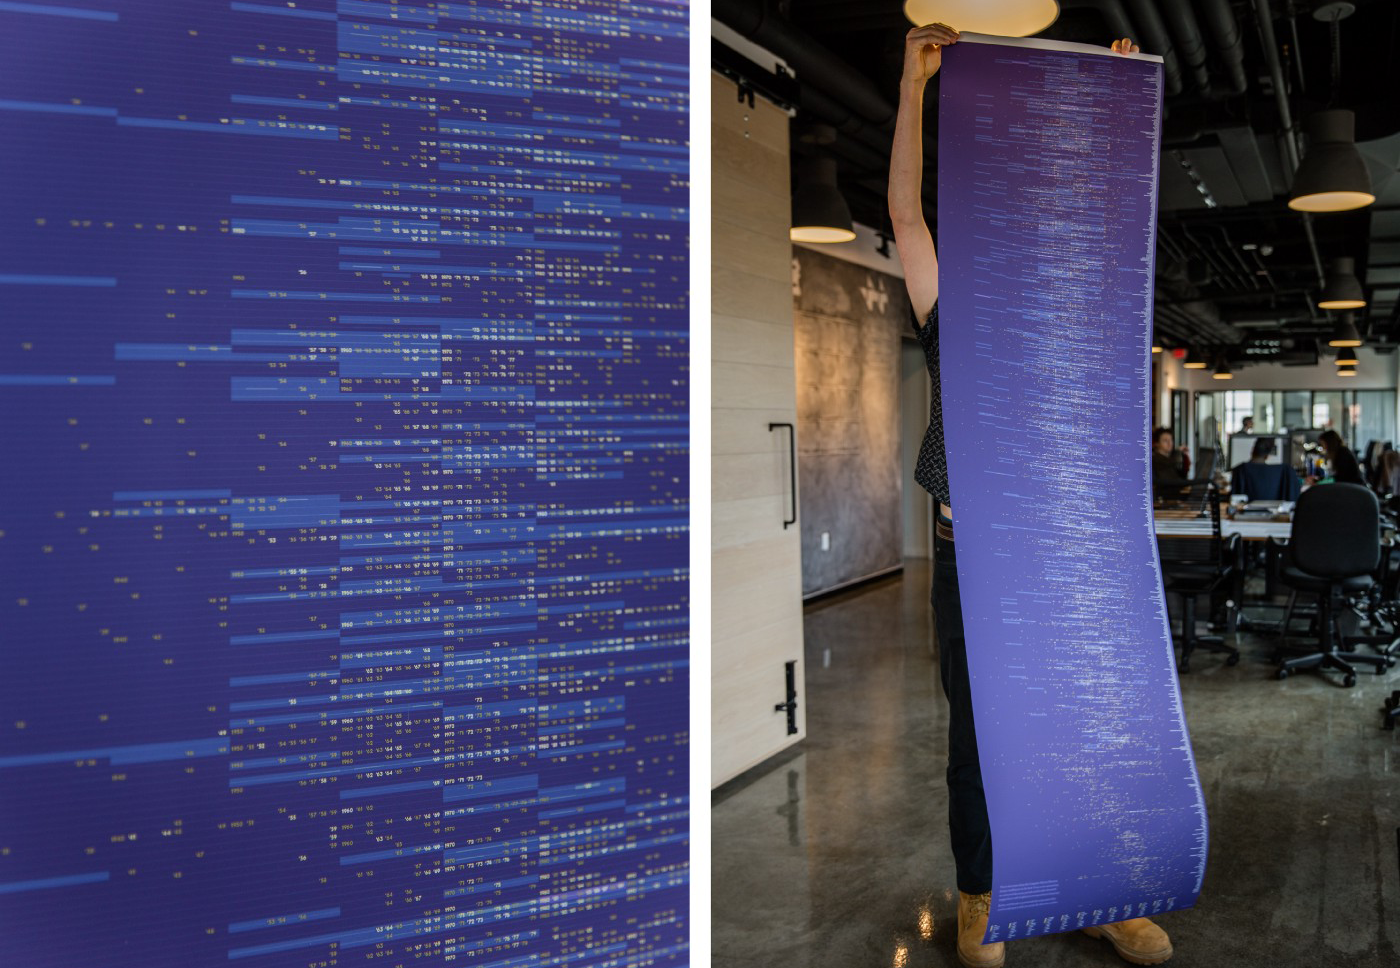

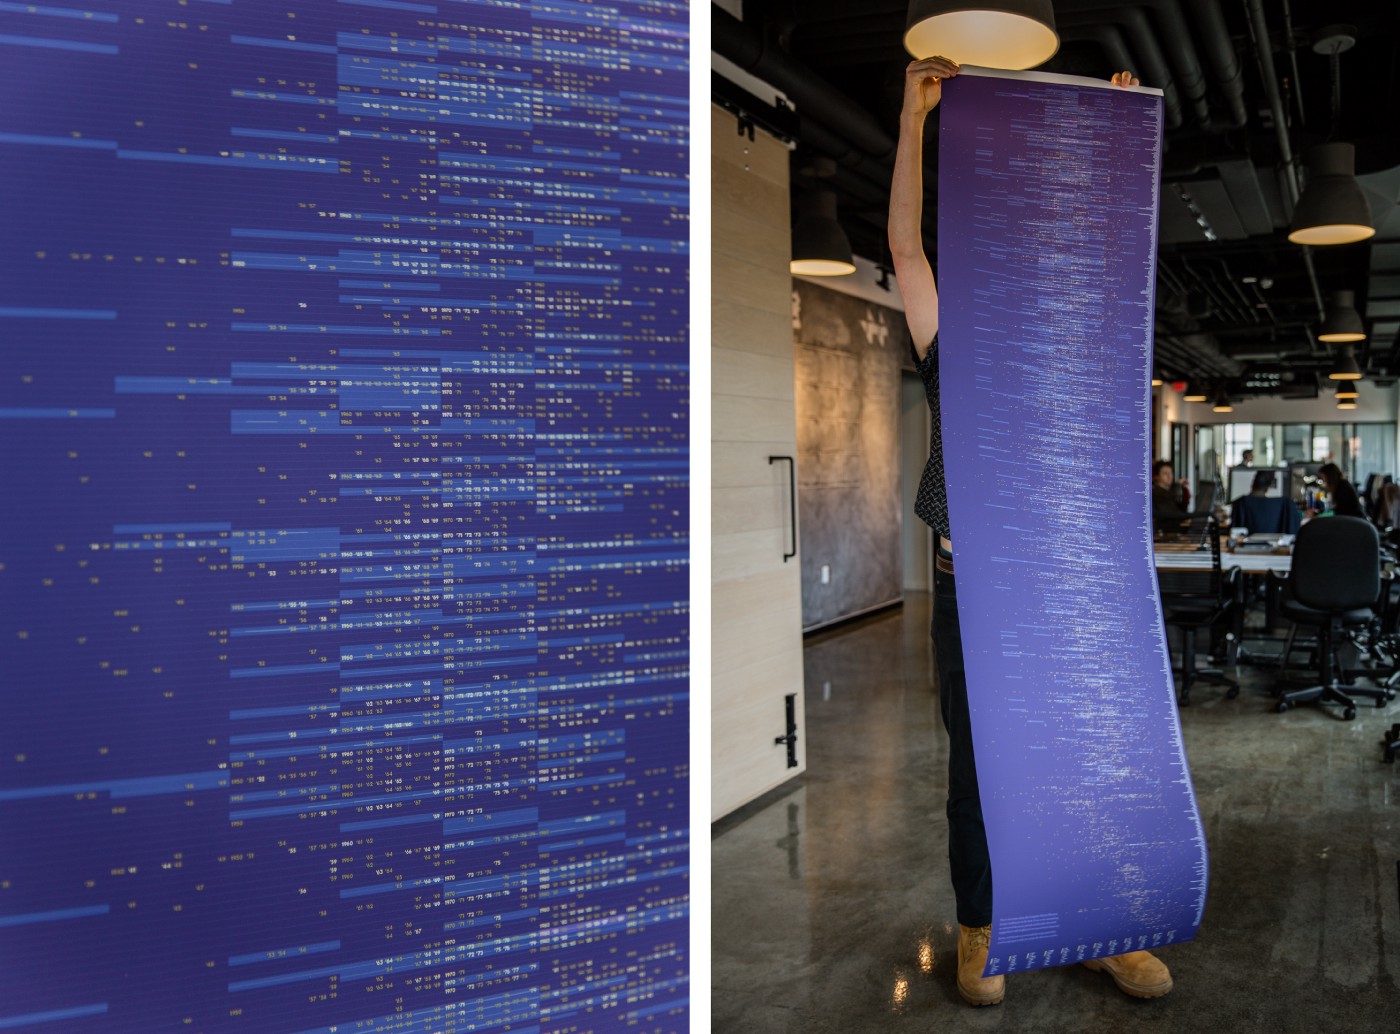
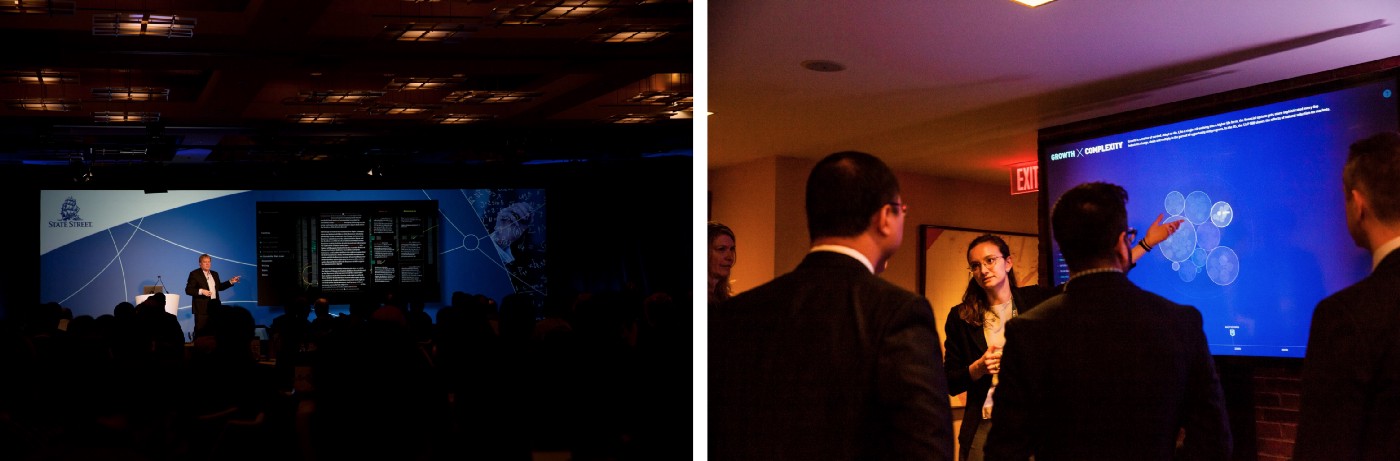
Recently, State Street hosted its annual Global Markets Research Retreat and invited Ben to speak on the importance of visualizing information and building interactive tools to understand data. We also hosted a demo of our interactive installation on the history of finance, which uses data to show changes in growth and complexity.
A few weeks ago, Rachel’s husband Nick was on Who Wants to be a Millionaire. Thinking of ways to prepare–in addition to brushing up on pop culture and practicing the order of U.S. presidents–Rachel started collecting data on past Millionaire contestants. Check out her findings!
Welcoming Ghosh and Charlie!
Ghosh is an Associate Professor of New Media at Ohio University, and is bringing his excitement for design and code to Fathom for the summer.

Our former intern, Charlie, is rejoining the Fathom team after getting his journalism degree from the University of Connecticut.

We’d love to hear what you’re working on, what you’re curious about, and what messy data problems we can help you solve. Drop us a line at hello@fathom.info, or you can subscribe to our newsletter for updates.