Going into this project, our goal was to design an initial landscape overview of the documents. We wanted to find a way to see the nature, volume, and density of the content and connections within the archive.
For a first pass, we used other tools we’ve built to run topic modeling and key term identification on the oral histories. After sorting through these results, we concluded that the content of the archive itself was too homogeneous for modeling techniques that focus on extracting the differences between documents. All told, we decided to take a different approach–entity and date extraction.
Using a combination of regular expressions and natural language processing, we extracted the dates and entities mentioned in each interview. We went through multiple rounds of date extraction to get the most reliable data–excluding model numbers, and including what we call “casual dates.” Since the archive content is composed of people reflecting on their past, there are a lot of casual references to the 1960s or the 1970s, which are not to be confused with people talking about age (when they are in their 60s or 70s).
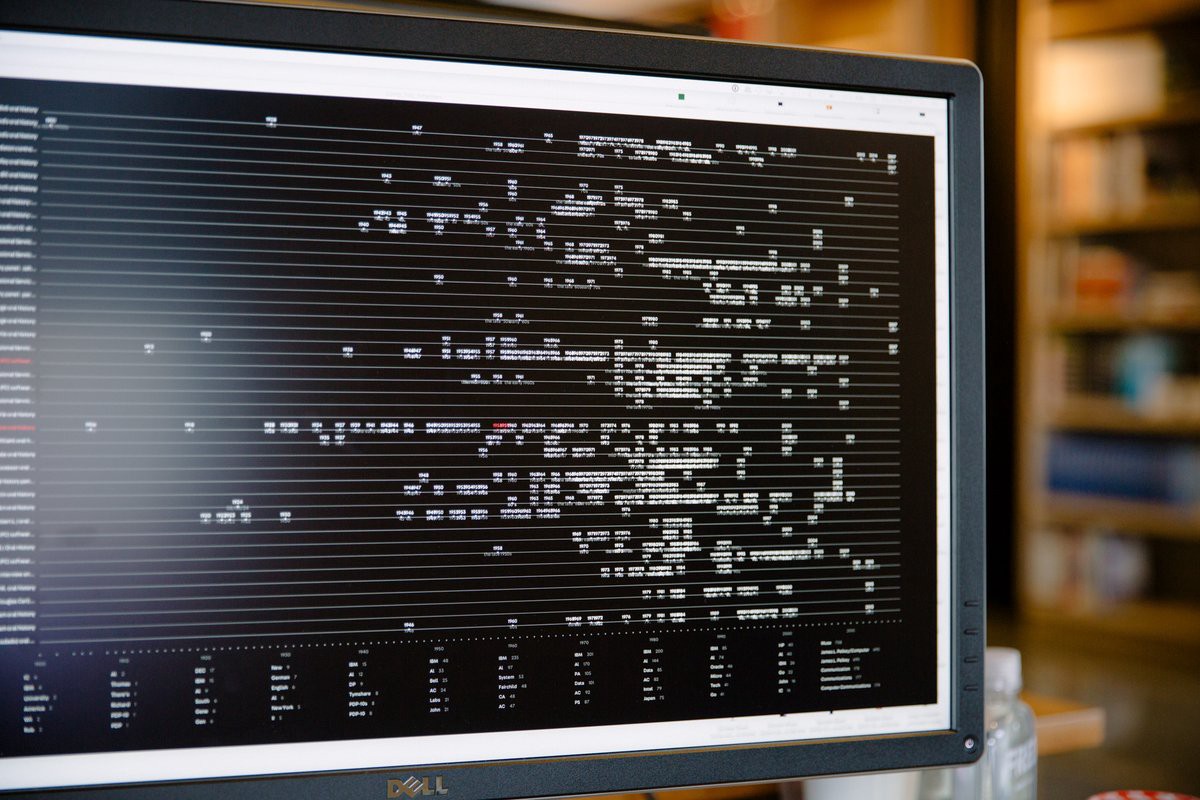
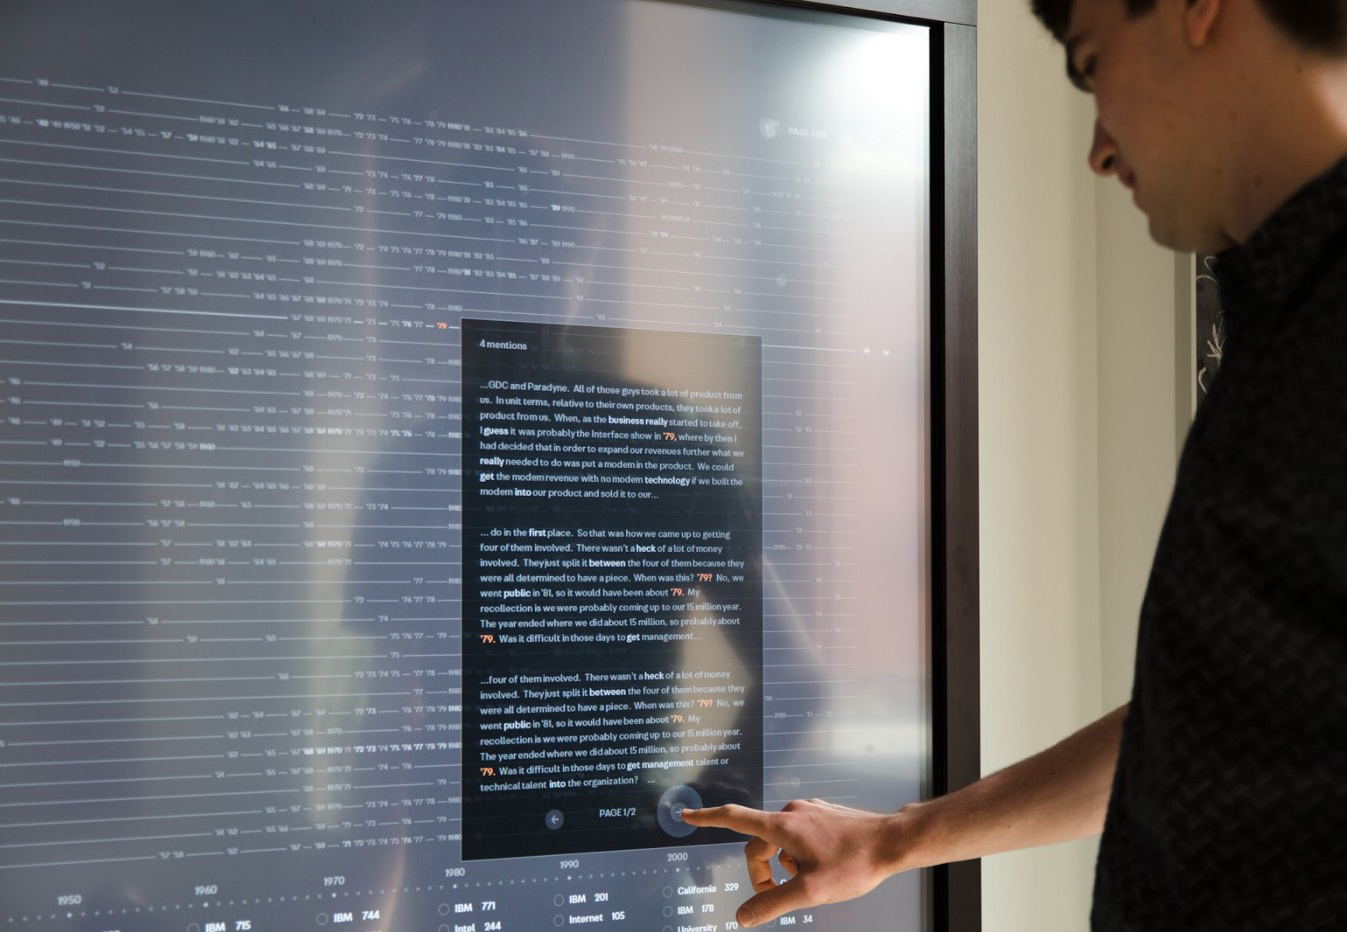
In the end, the results were promising, and we built a tool that depicts a personal timeline of the extracted years for each interview. Since the documents themselves are so time-centric, extracting the years and plotting them for each interview was a helpful way to pull apart and organize the archive.
We also extracted entities and calculated which ones are the most frequently mentioned in relation to each year. In the early 20th century, for example, the most used terms include World War and Russia. Not surprisingly, in relation to more recent years, we see California emerging as a top term. And either by the nature of the interviewees or perhaps indicative of the company itself, IBM continually ranks in the top terms mentioned throughout the century.

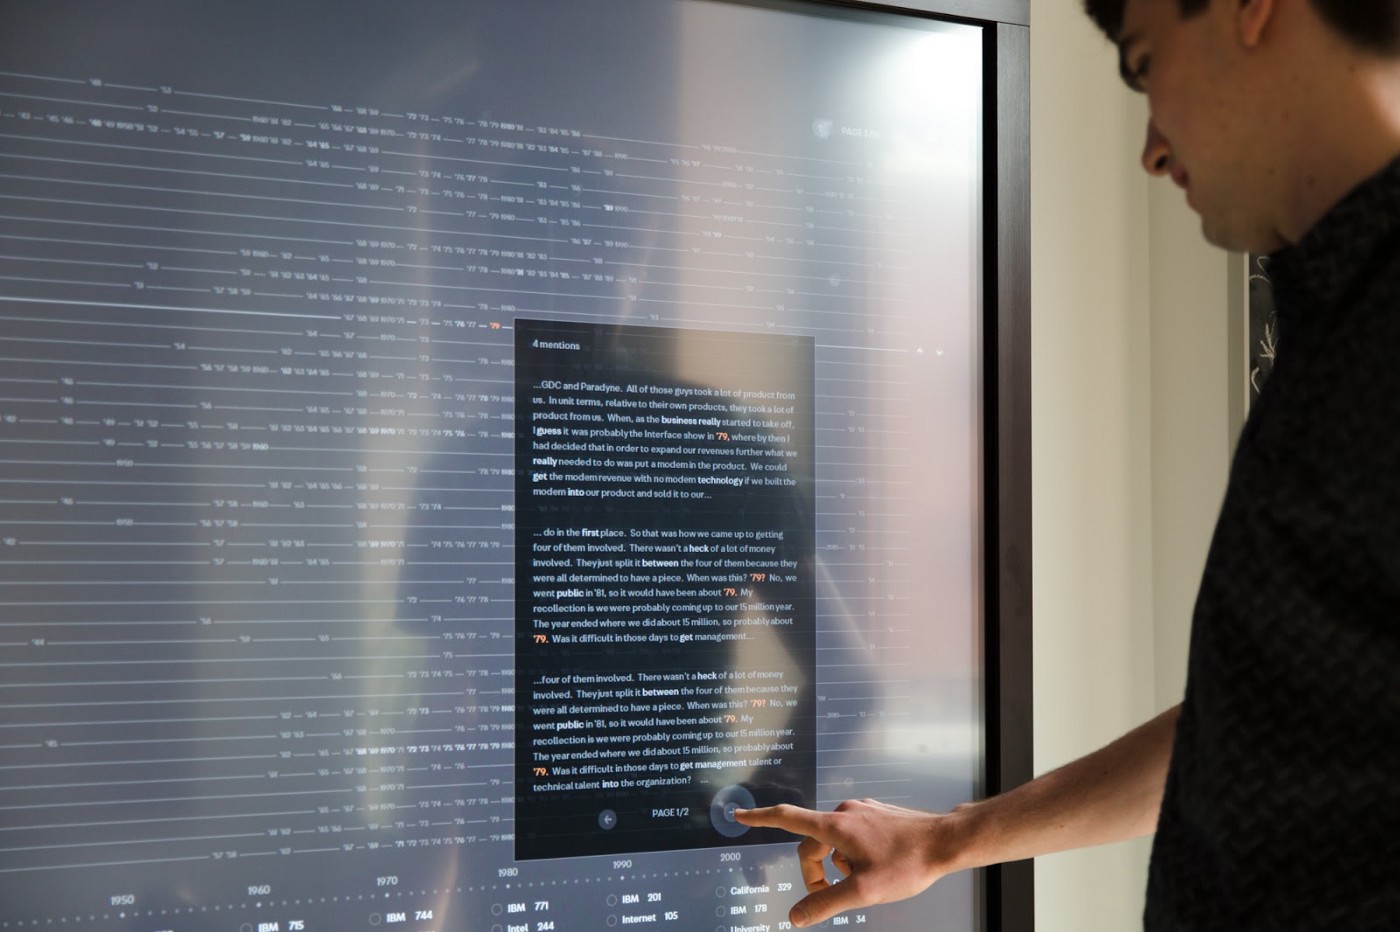
The tool allows the user to explore the relationships between the years and the mentioned technologies, companies, and locations. Users can filter by the top terms, pinpoint specific mentions, and dig into the surrounding context from the interview.
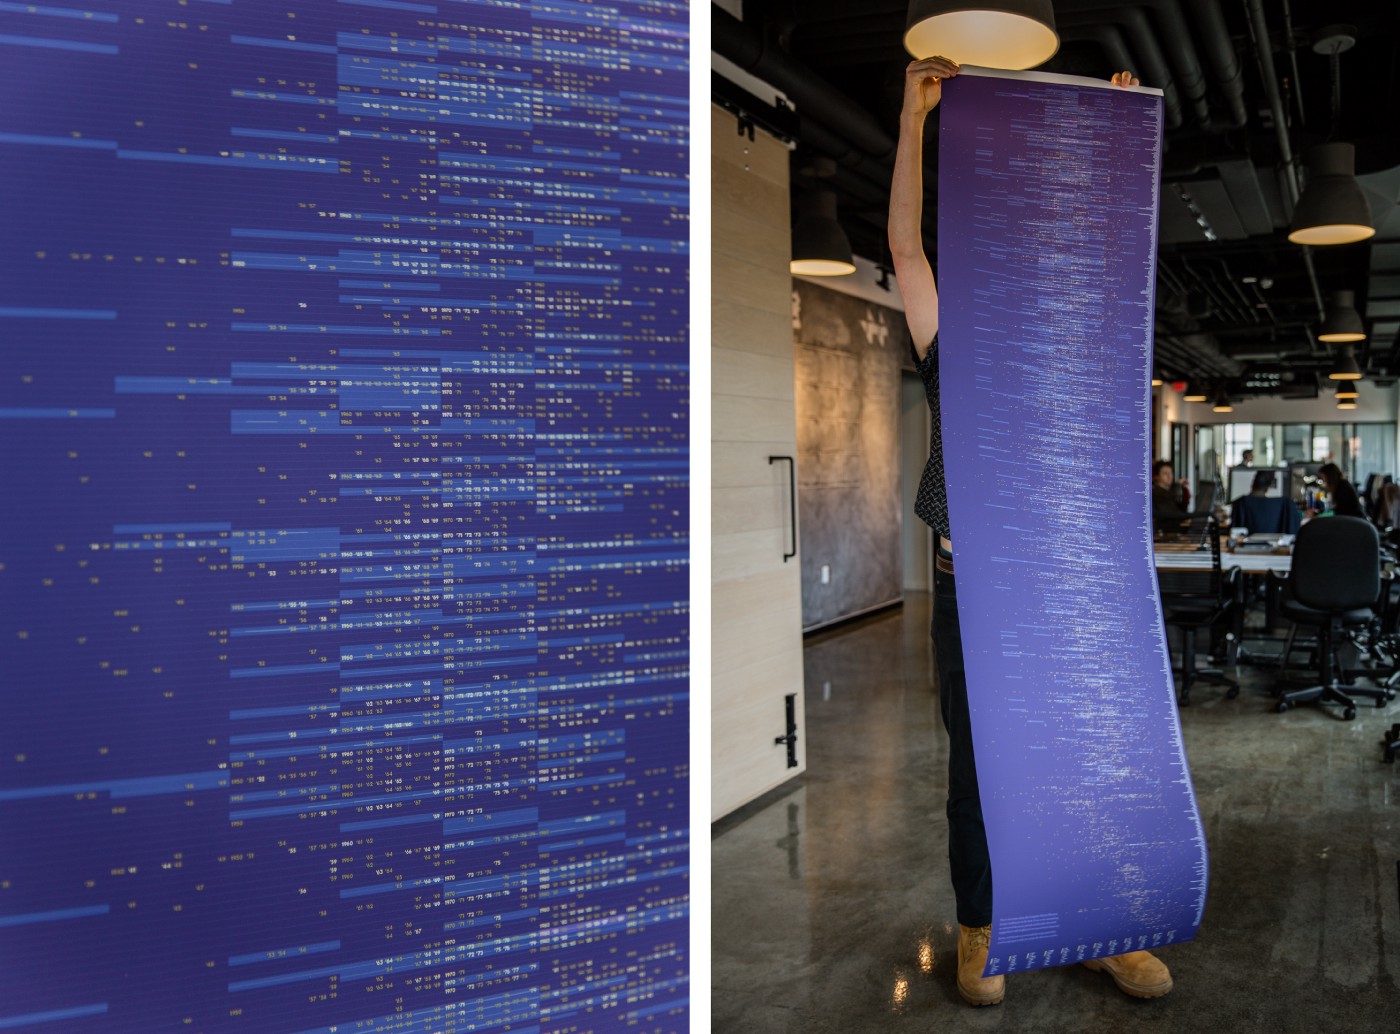
In addition to the tool, we designed a poster that depicts a more “cartographic” view of the years mentioned in the interviews. The print weaves together both the discrete and casual dates, revealing the breadth of years referenced and the concentration of these mentions in the 60s, 70s, and 80s.
The tool and poster present overviews of the archive through the lens of time. More importantly though, they function as a guide for people who want to explore the archive, equipping them with an understanding of the topography of the interview timelines and content.
Since dates are often a key part of document sets, we’re excited to continue exploring these methods in future tools with other archives.
We’d love to hear what you’re working on, what you’re curious about, and what messy data problems we can help you solve. Drop us a line at hello@fathom.info, or you can subscribe to our newsletter for updates.