The project breaks down the food items that fuel the daily diet of each country, and also shares a detailed view of national and per person meat intake. Adding the lens of meat consumption is important in that it sheds light on the larger agricultural, economic, and political systems in each nation. The project data was sourced from the Food and Agriculture Organization of the United Nations (FAO), which has collected a trove of global data on food production, consumption, trade, emissions, and other agricultural indicators.
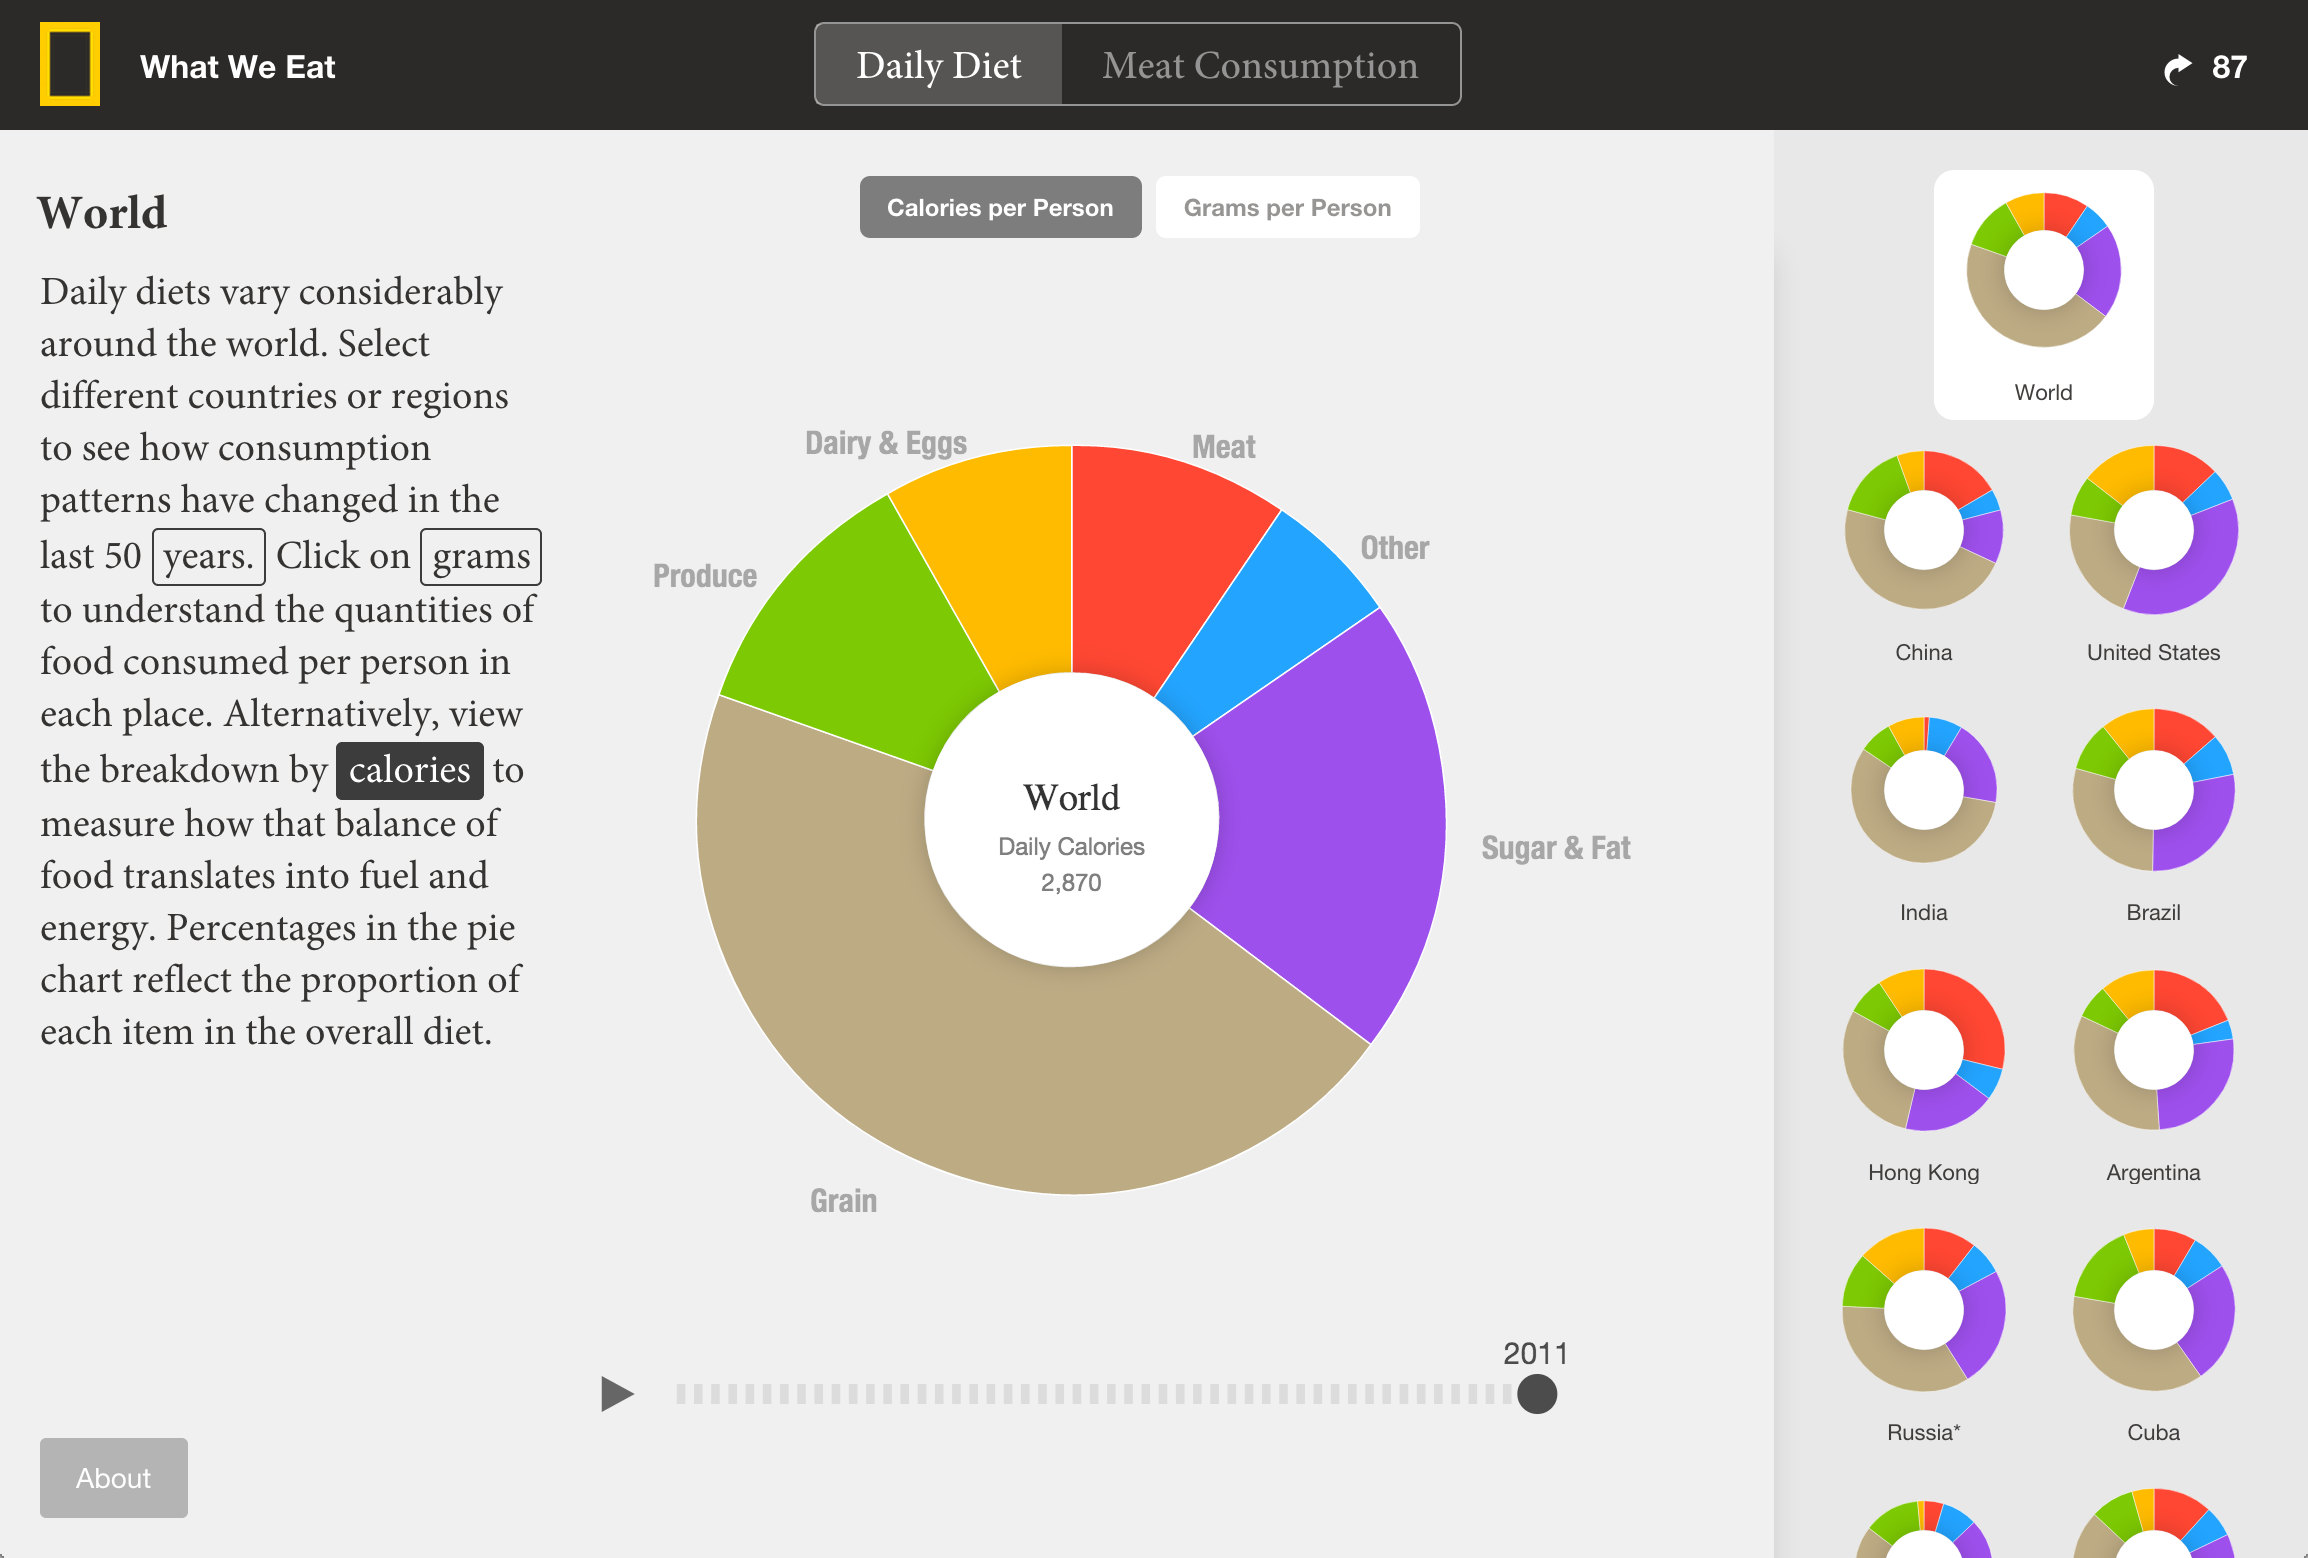
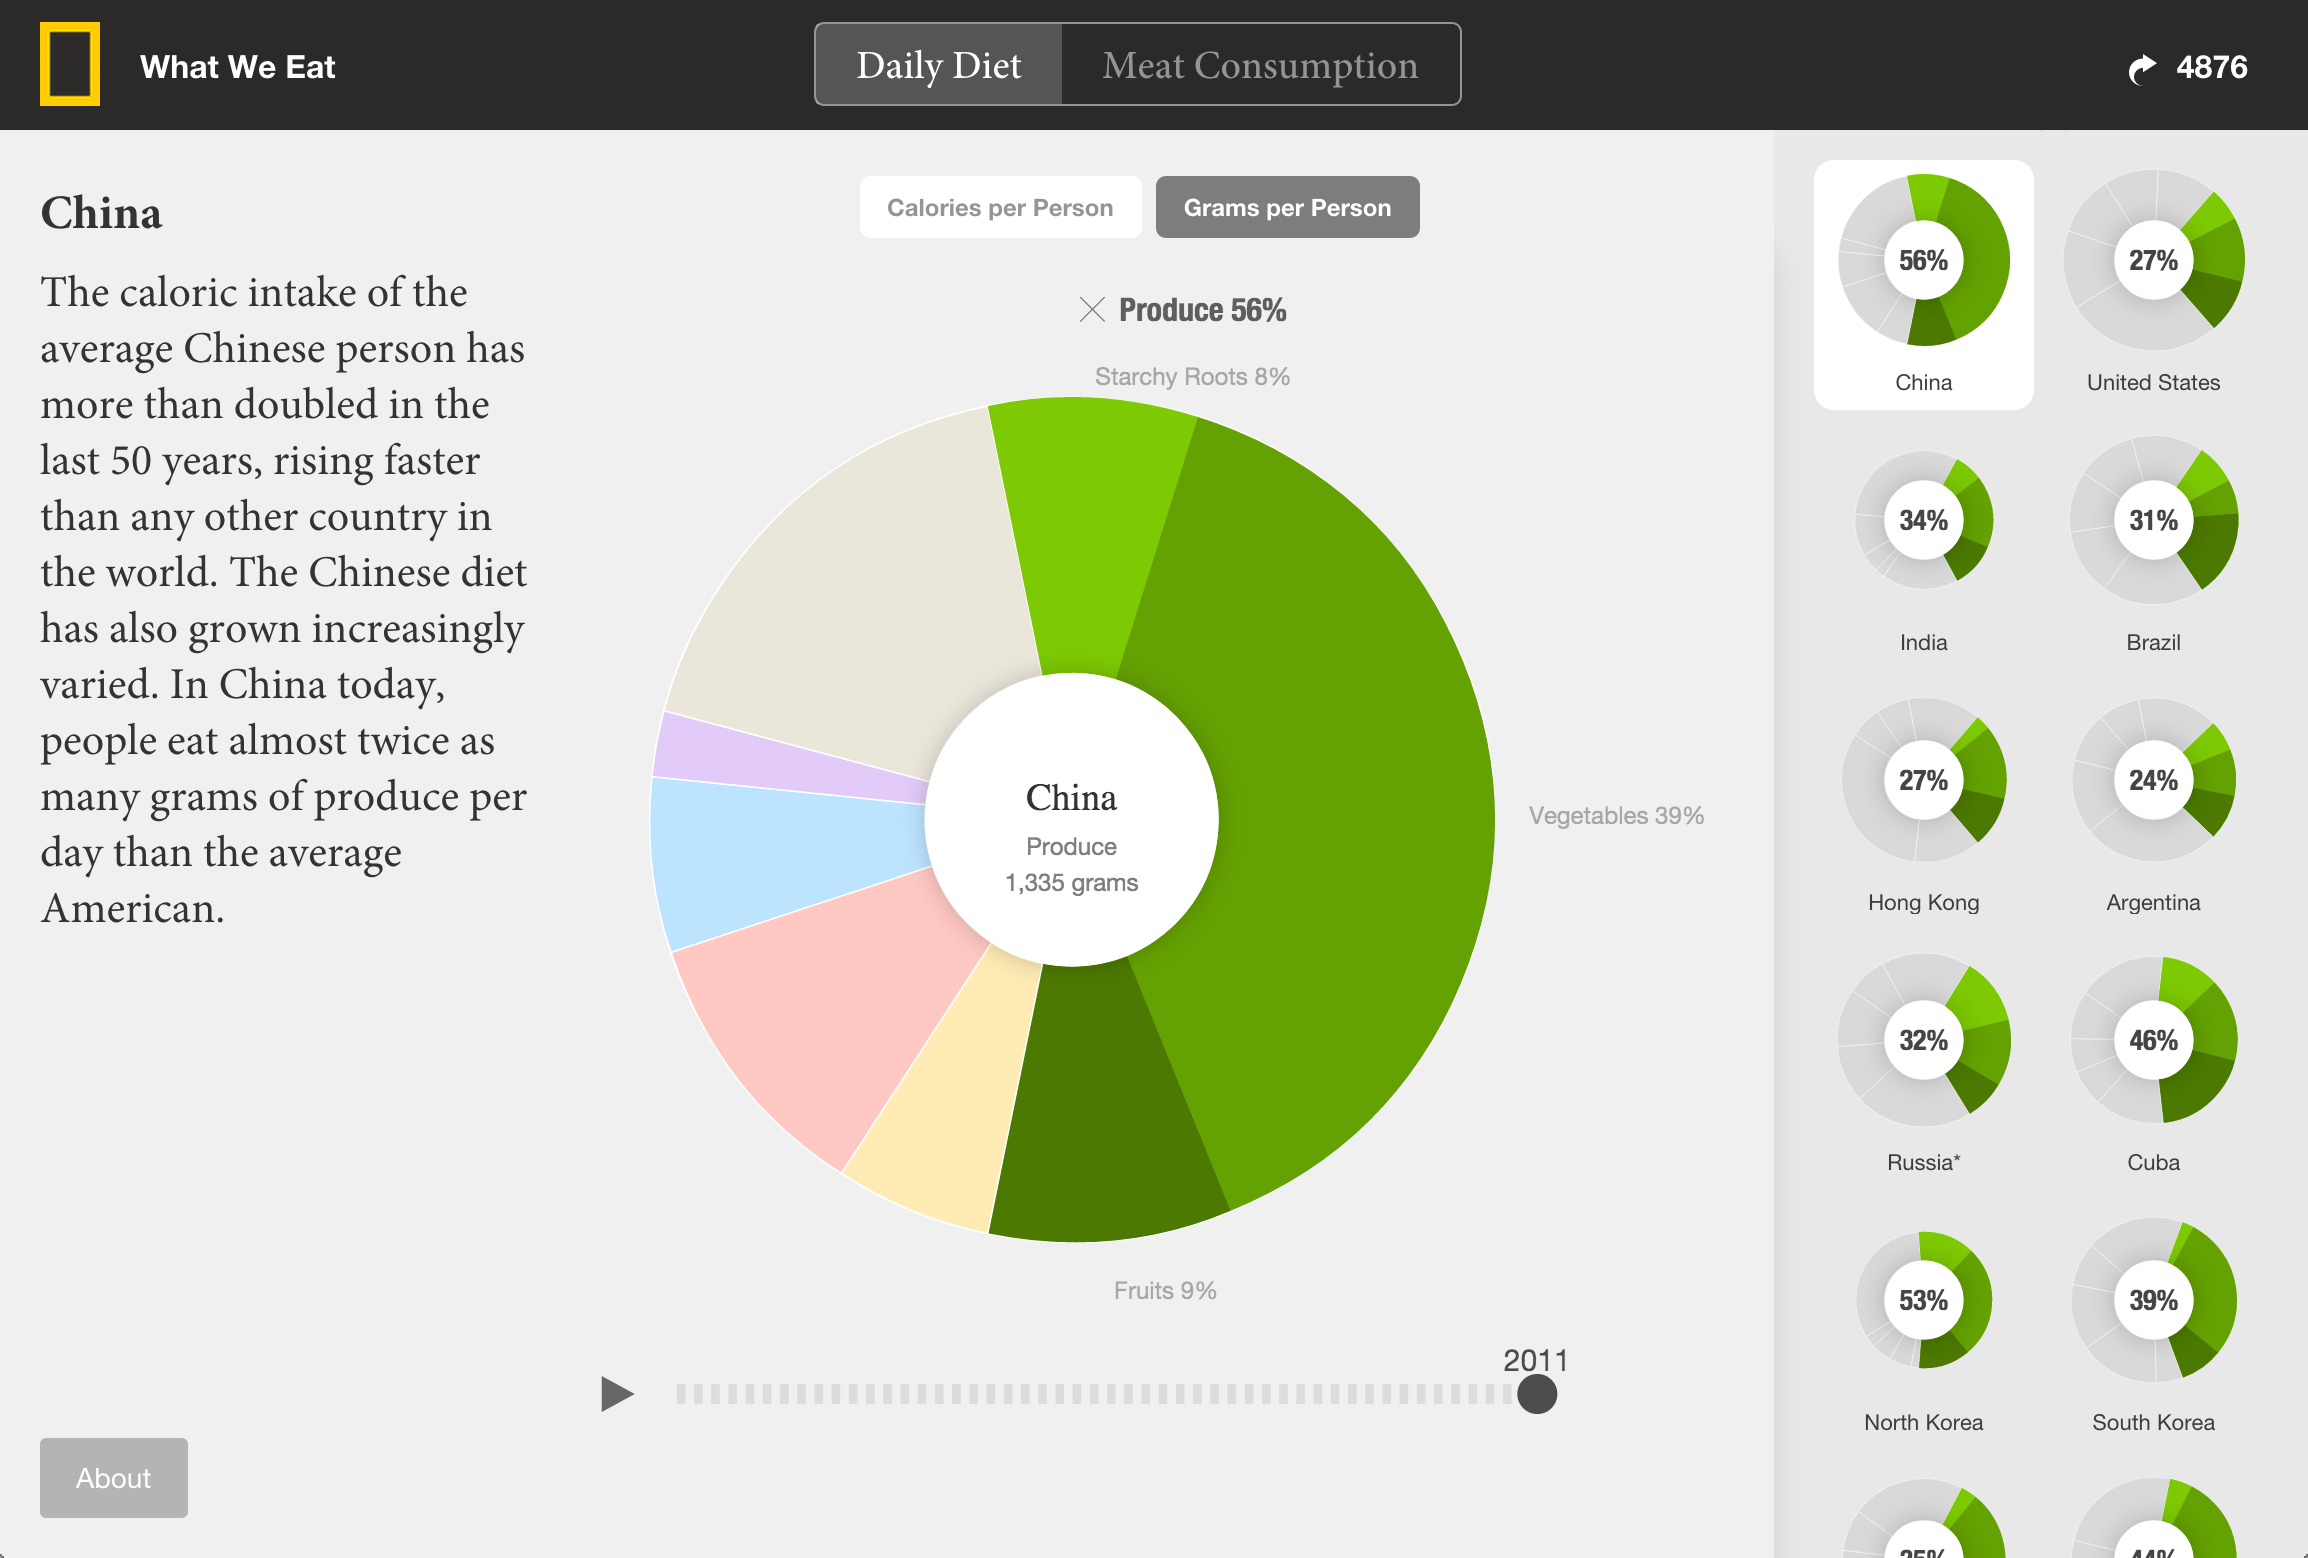
We designed the information in two forms. The daily diets are represented by pie charts (or “donuts” as they’re now known around the office, and cited regularly to remind Terrence that he should bring in radial morning treats for the rest of us). The proportion of each food item (meat, dairy, produce, etc.) in the diet is represented by the amount of space it occupies in the circle. In developing countries, grains -- which are often less expensive -- make up a greater portion of the diet, whereas wealthier countries have more diverse breakdowns. Circle size reflects the average daily intake of calories or grams per person. Somalia, with the lowest per person calorie consumption in the world, has a chart that is half the area of the U.S. chart (where the average person consumes over twice the calories of the typical Somali).
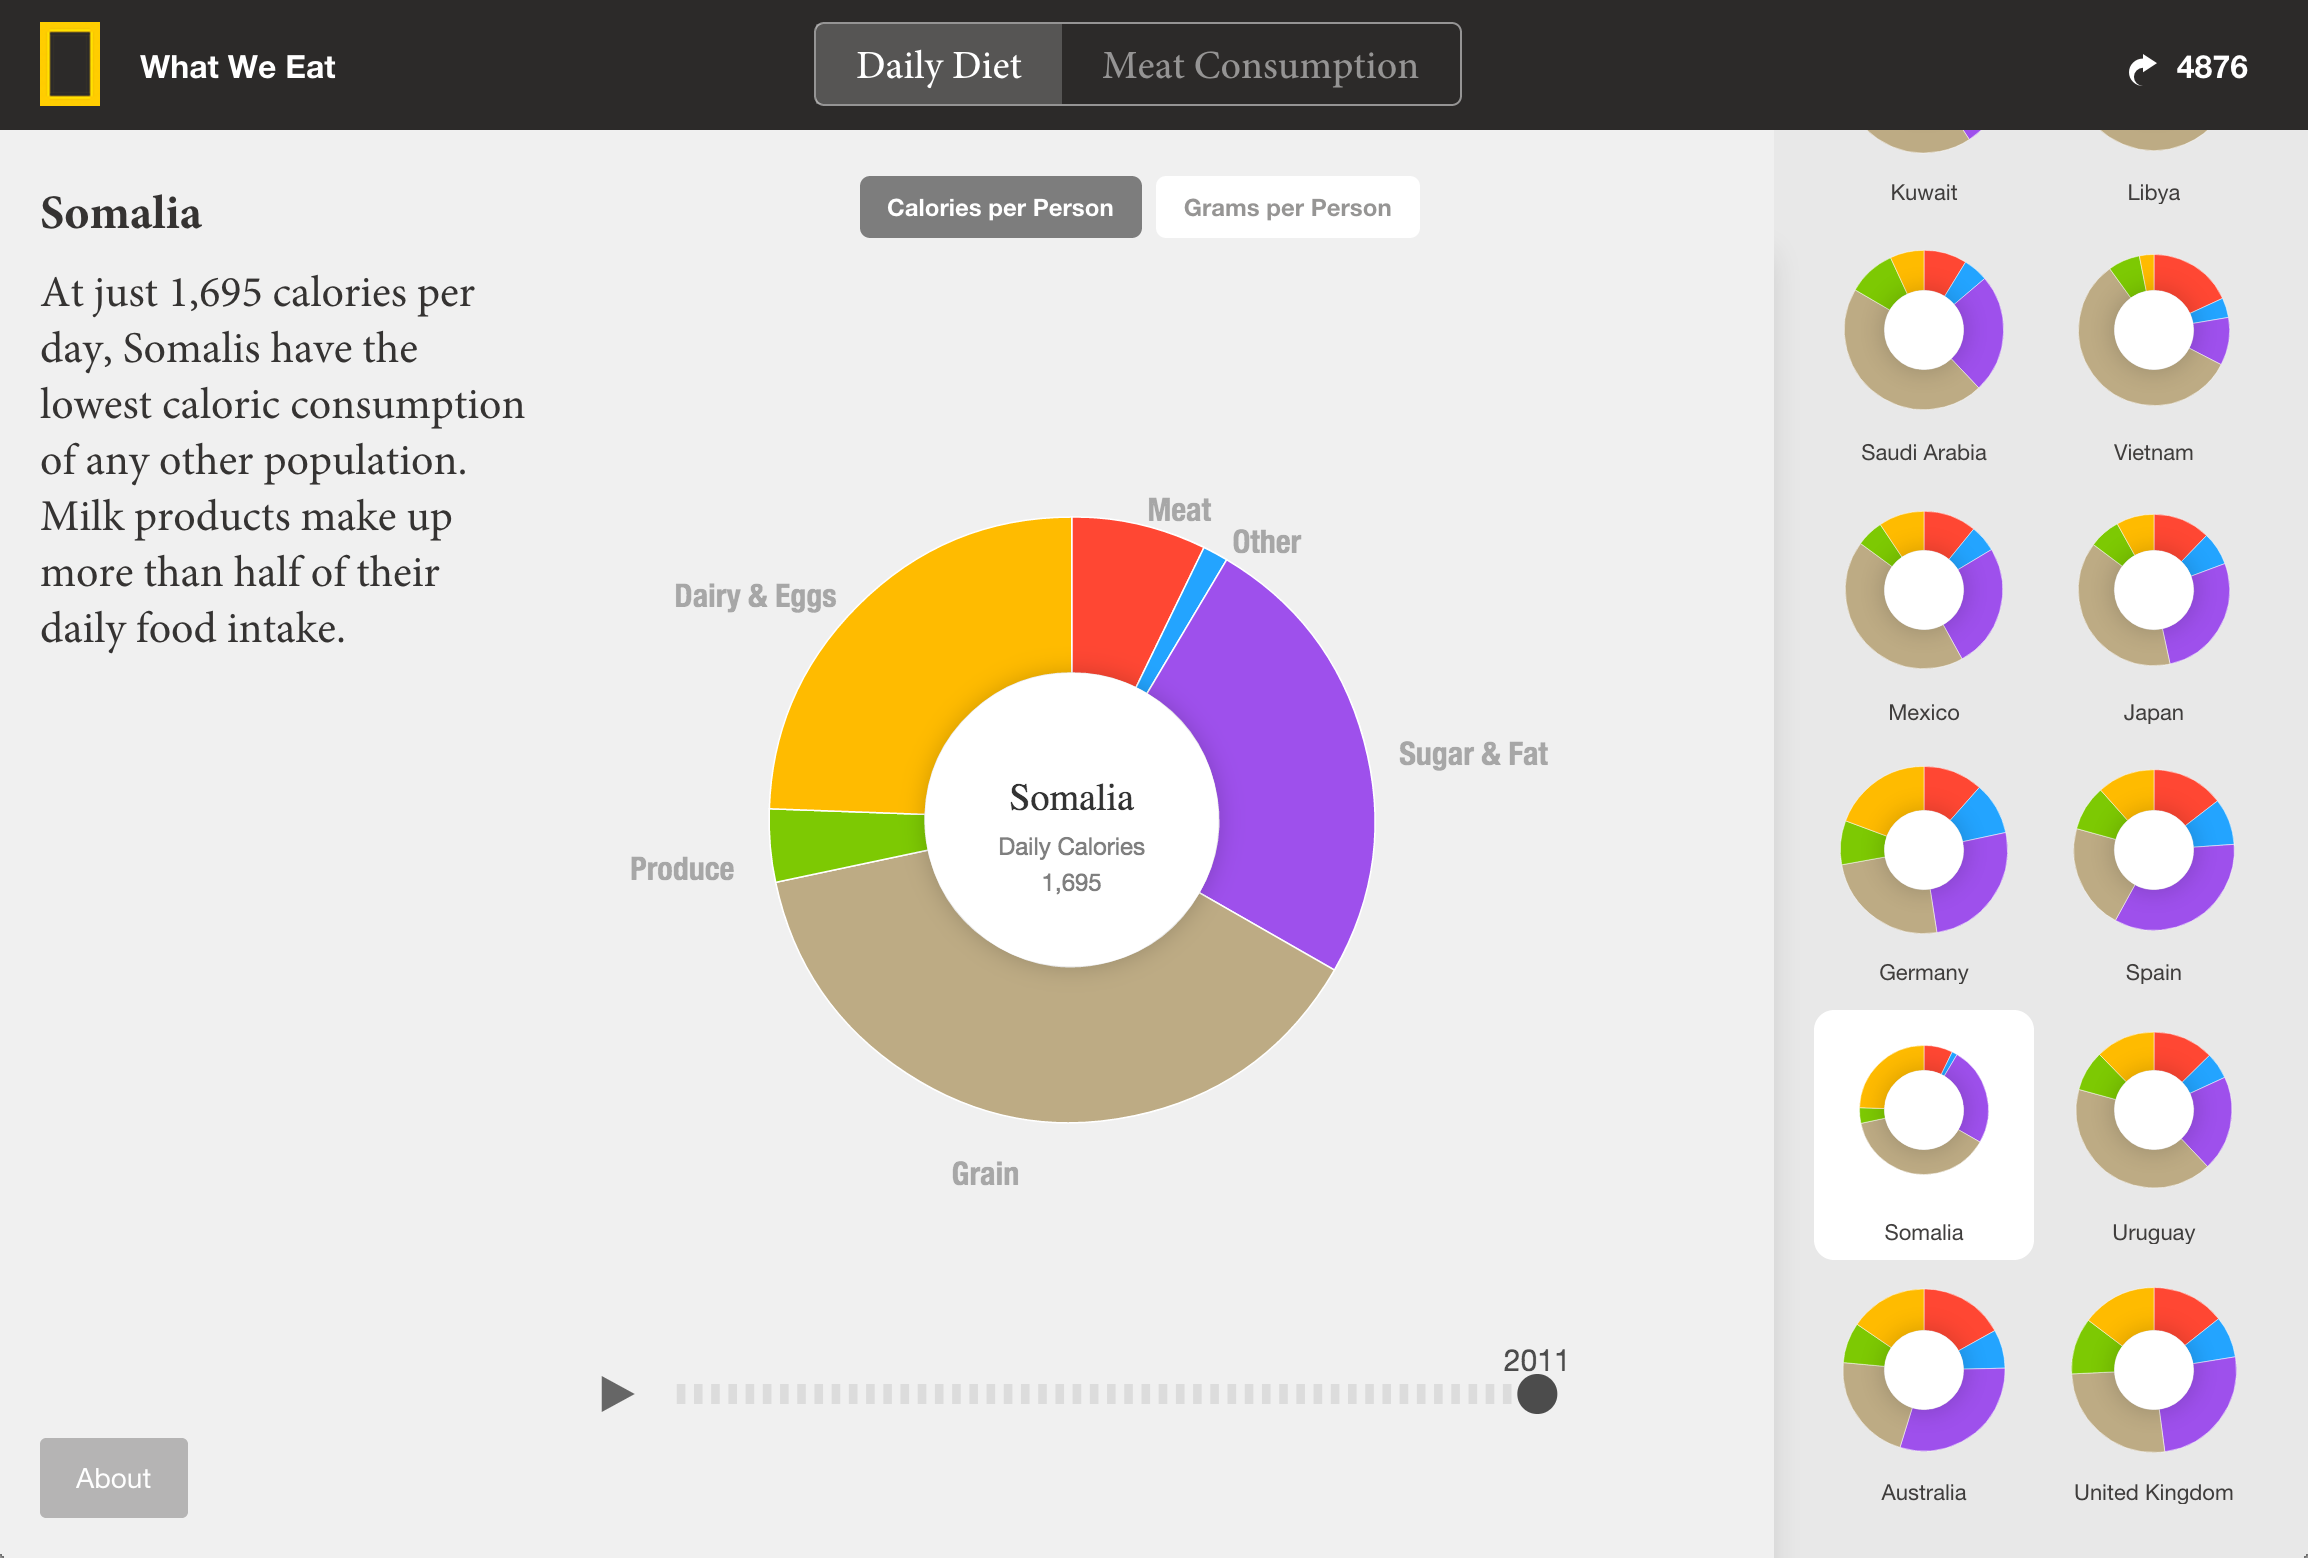
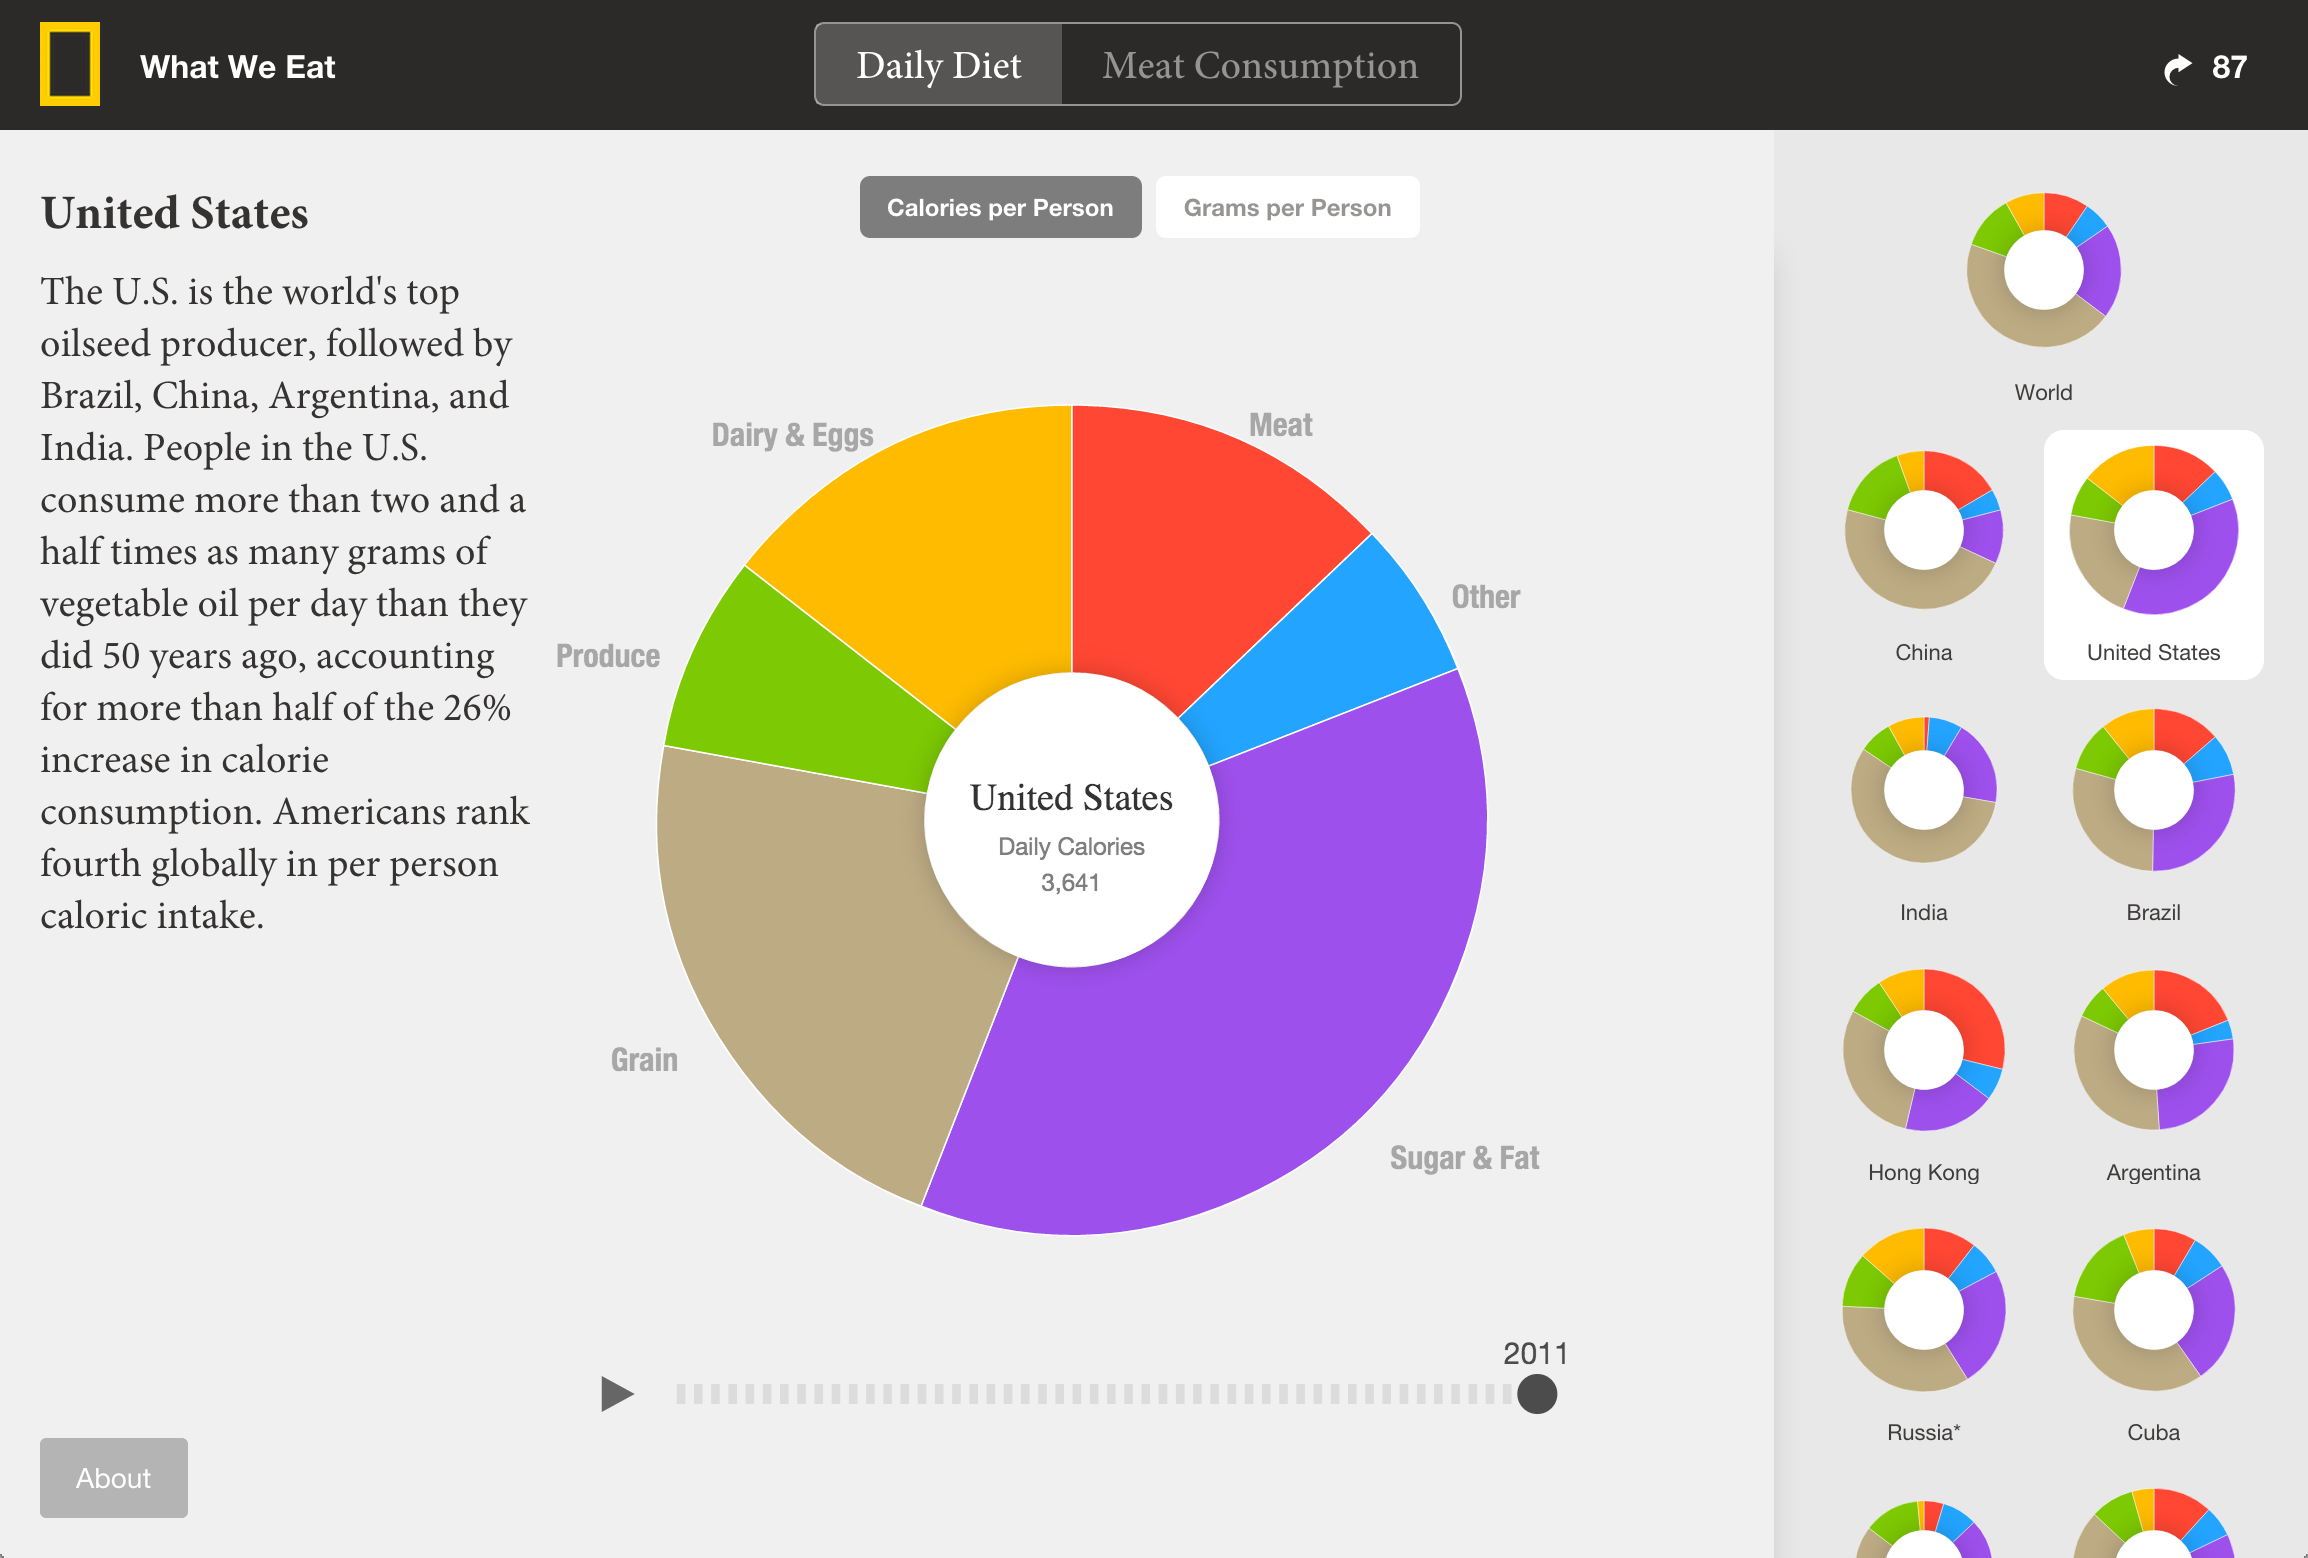
In toggling between grams and calories, you can see that quantity of food consumption does not translate into caloric yields. For instance, over half of the typical Chinese diet is composed of produce, yet it accounts for only 15% of daily caloric intake.

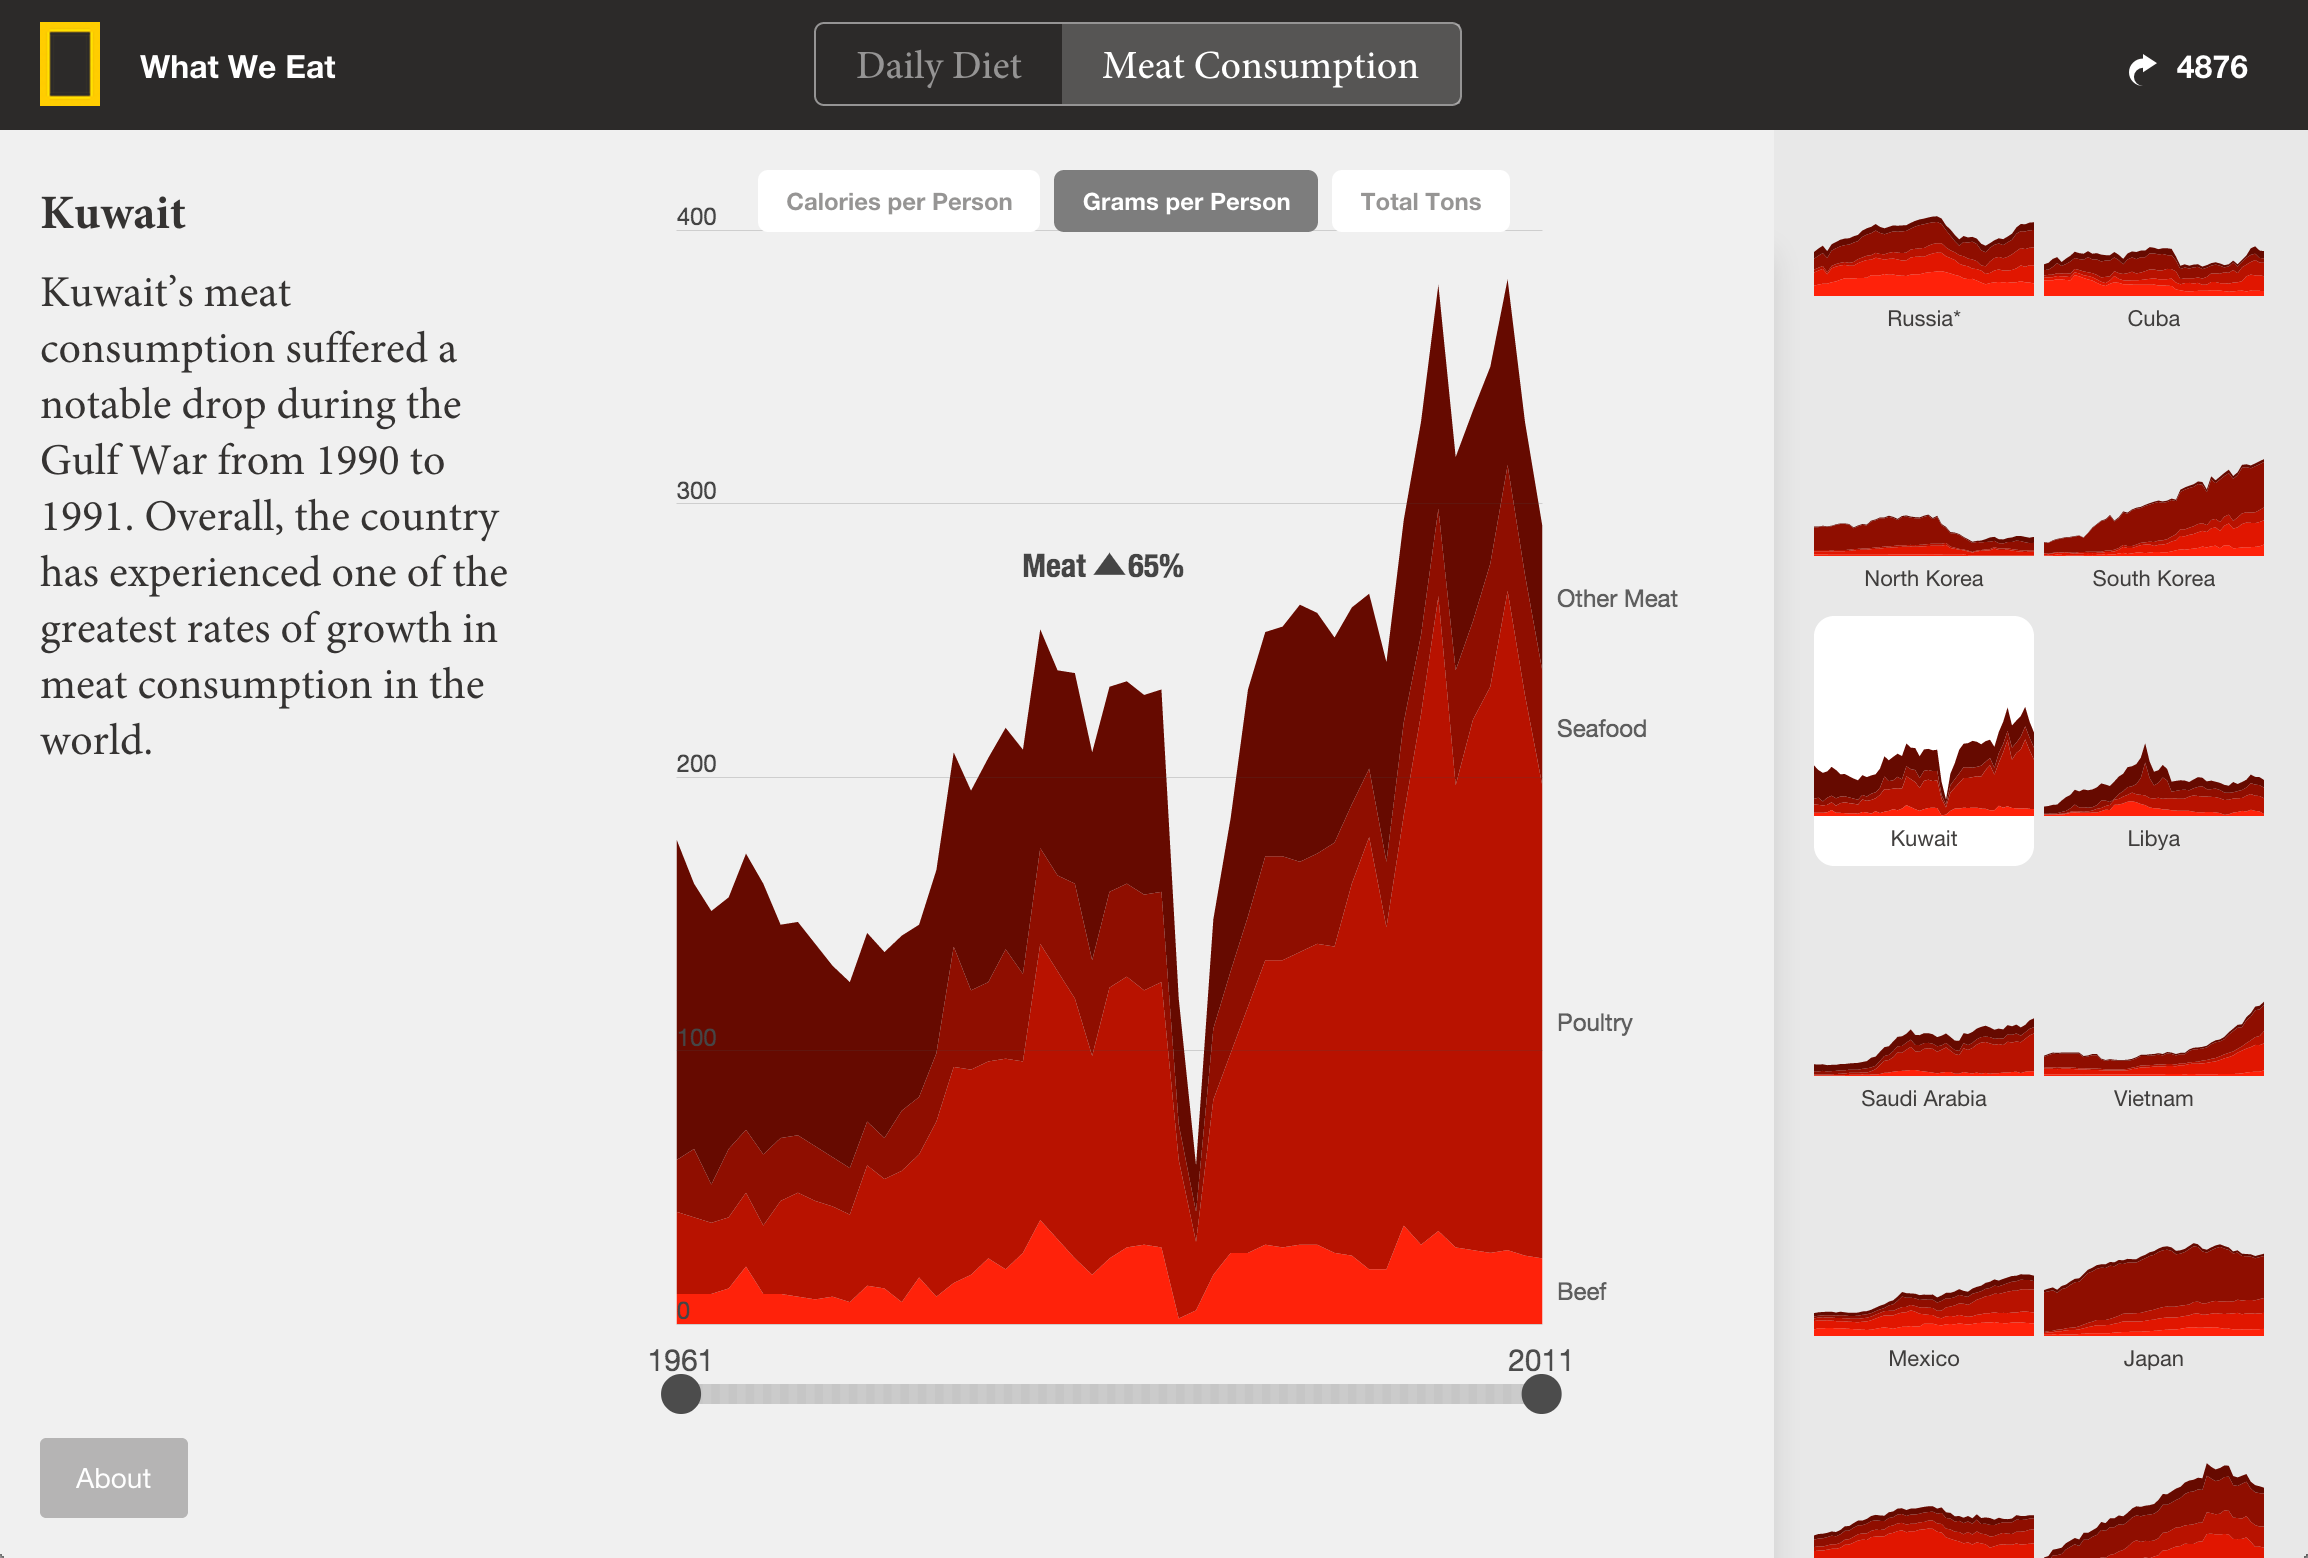
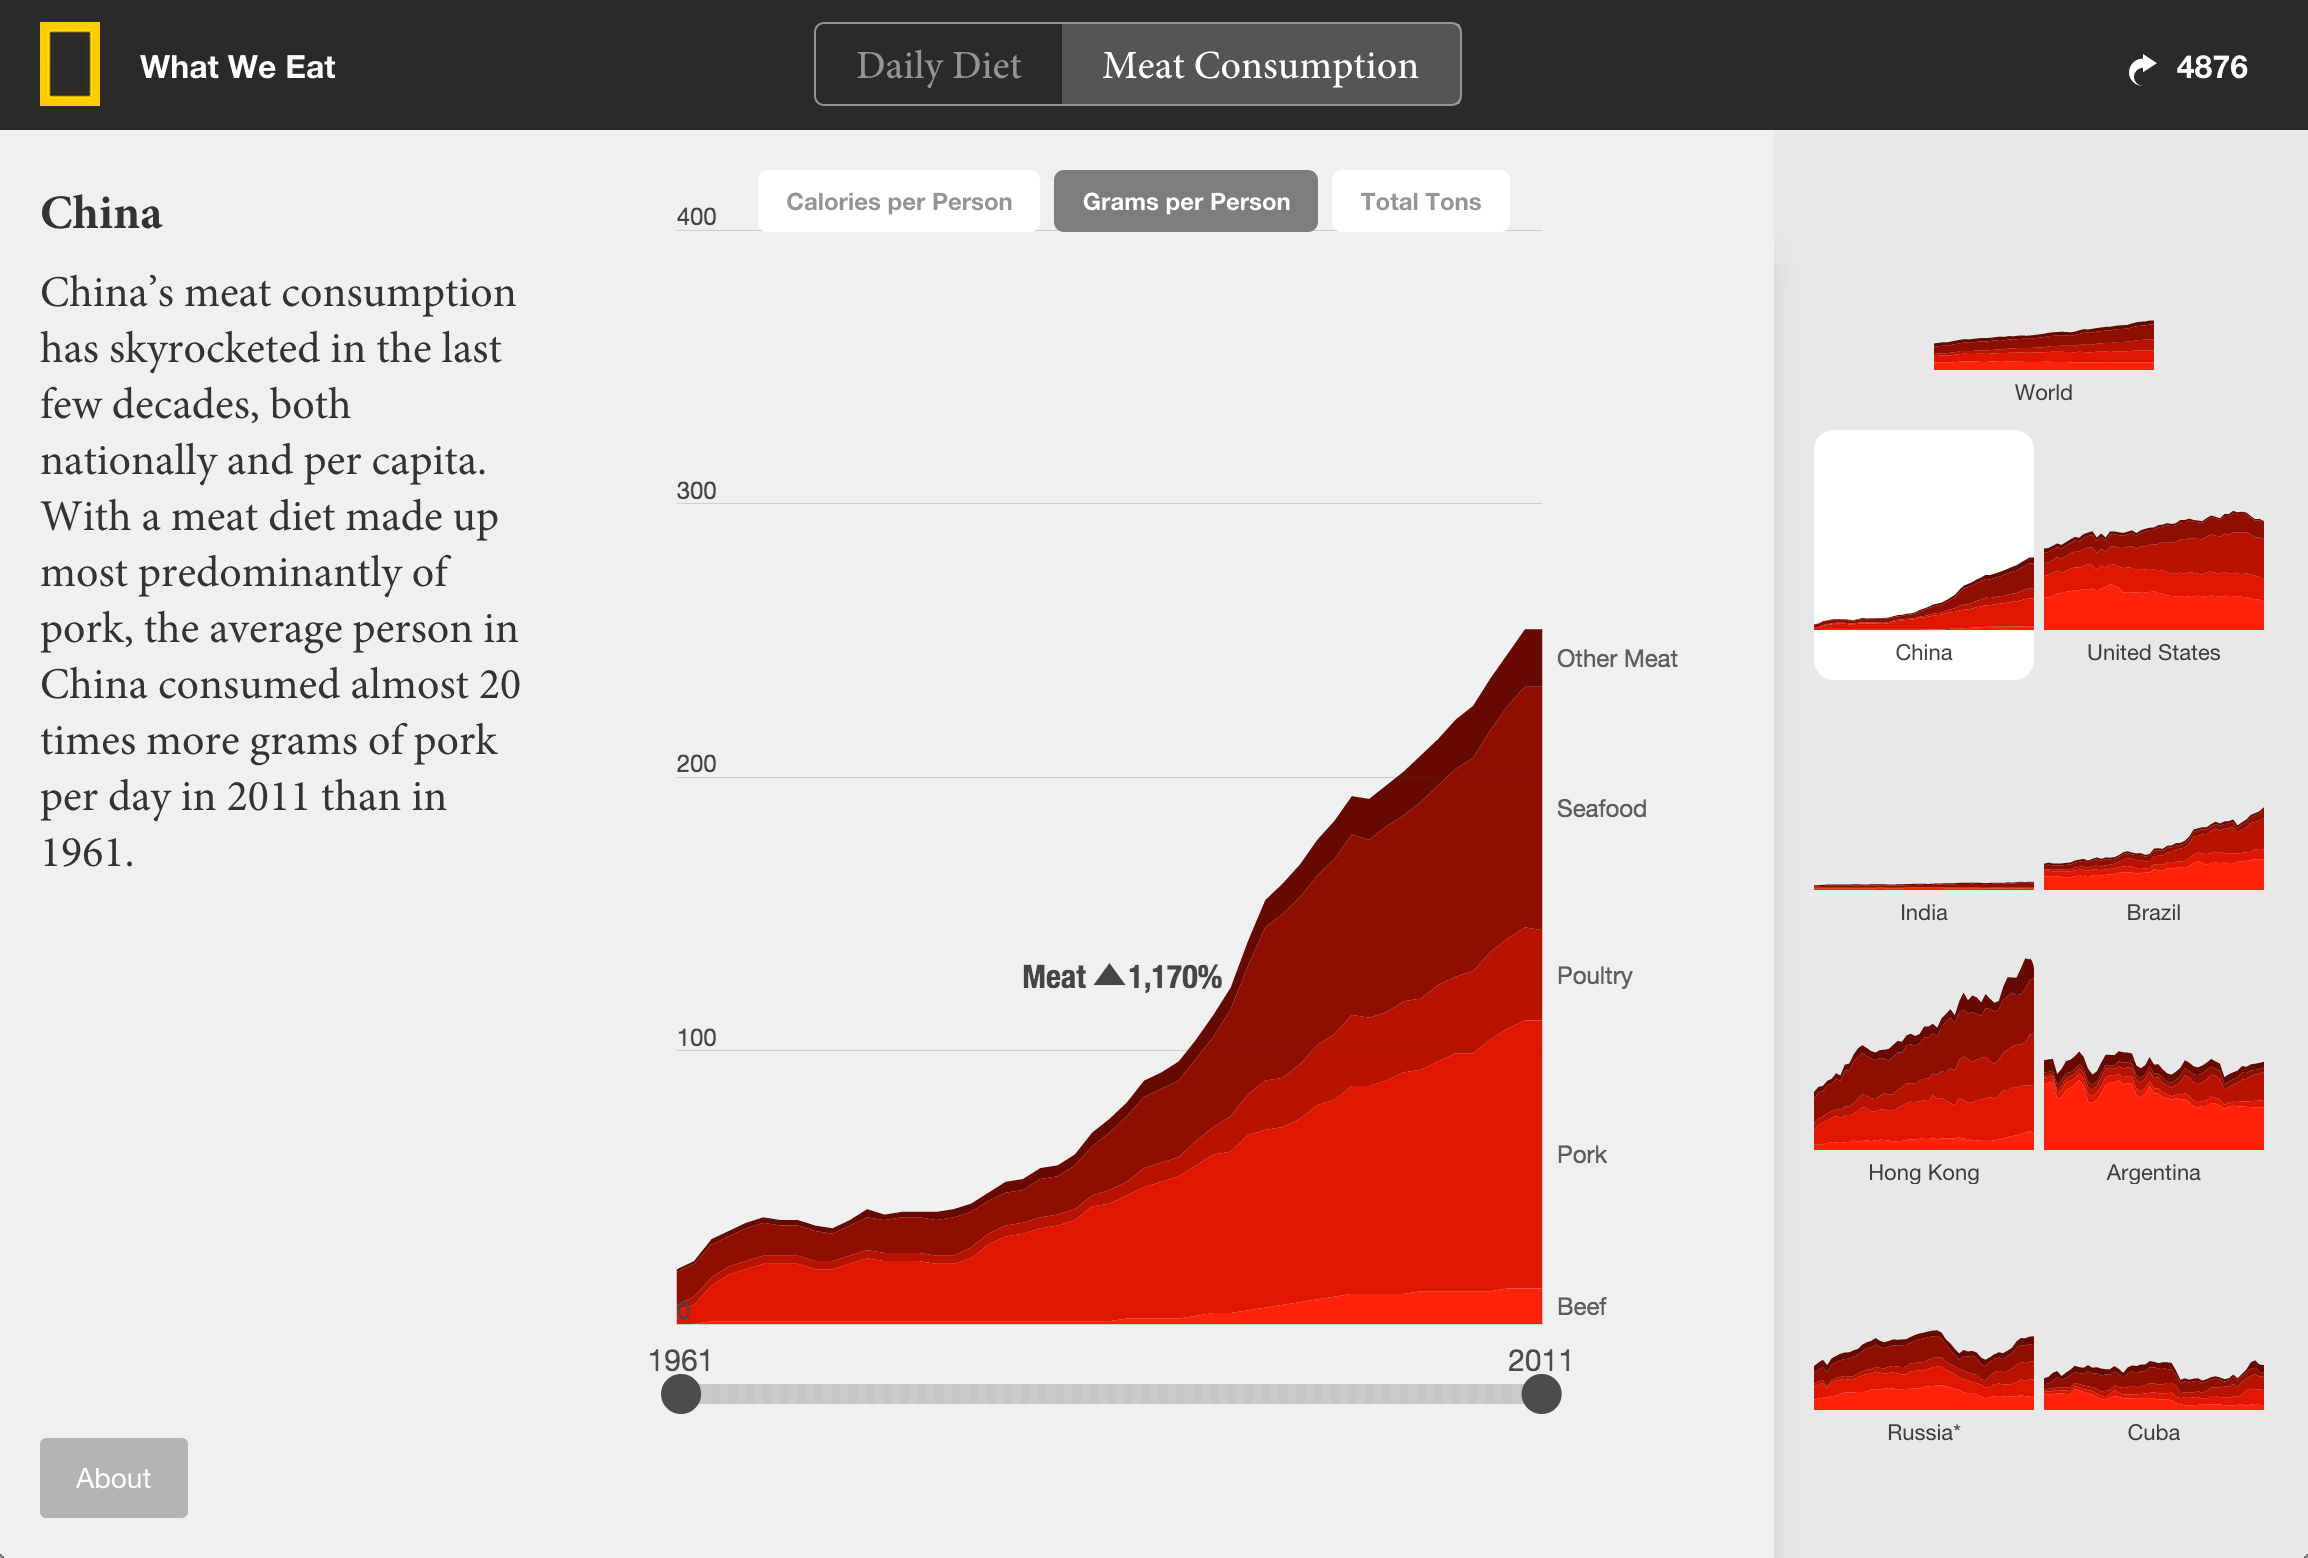
The second section of the graphic, meat consumption, is composed of time series charts. Given the high cost and multitude of resources required to raise animals, national meat consumption is more susceptible than the overall diet to changing external circumstances.
Raising animals for meat consumption is taxing to both agricultural and financial resources. Livestock-based food production accounts for about 20% of global greenhouse gas emissions. Further, raising animals for food demands far more water, feed, and land than it would otherwise require to eat crops directly (note, a single cow requires a lifespan’s worth of resources, whereas using a space for crop production can yield foodstuffs annually). To bring Thomas Malthus into the discussion, we have a limited quantity of natural resources needed to feed an exponentially increasing population. The average person today eats twice as much meat than 50 years ago. Yet eating meat -- especially livestock-- is an inefficient means of feeding the earth's fast-growing population.
Often as countries acquire more wealth, the proportion of grains in the diet declines, and individuals are better able to diversify the contents of their plates with more expensive animal products like meat and dairy. Additionally, impacts of war, tense foreign relations, and even widespread religious practices are visible through a country's meat consumption.
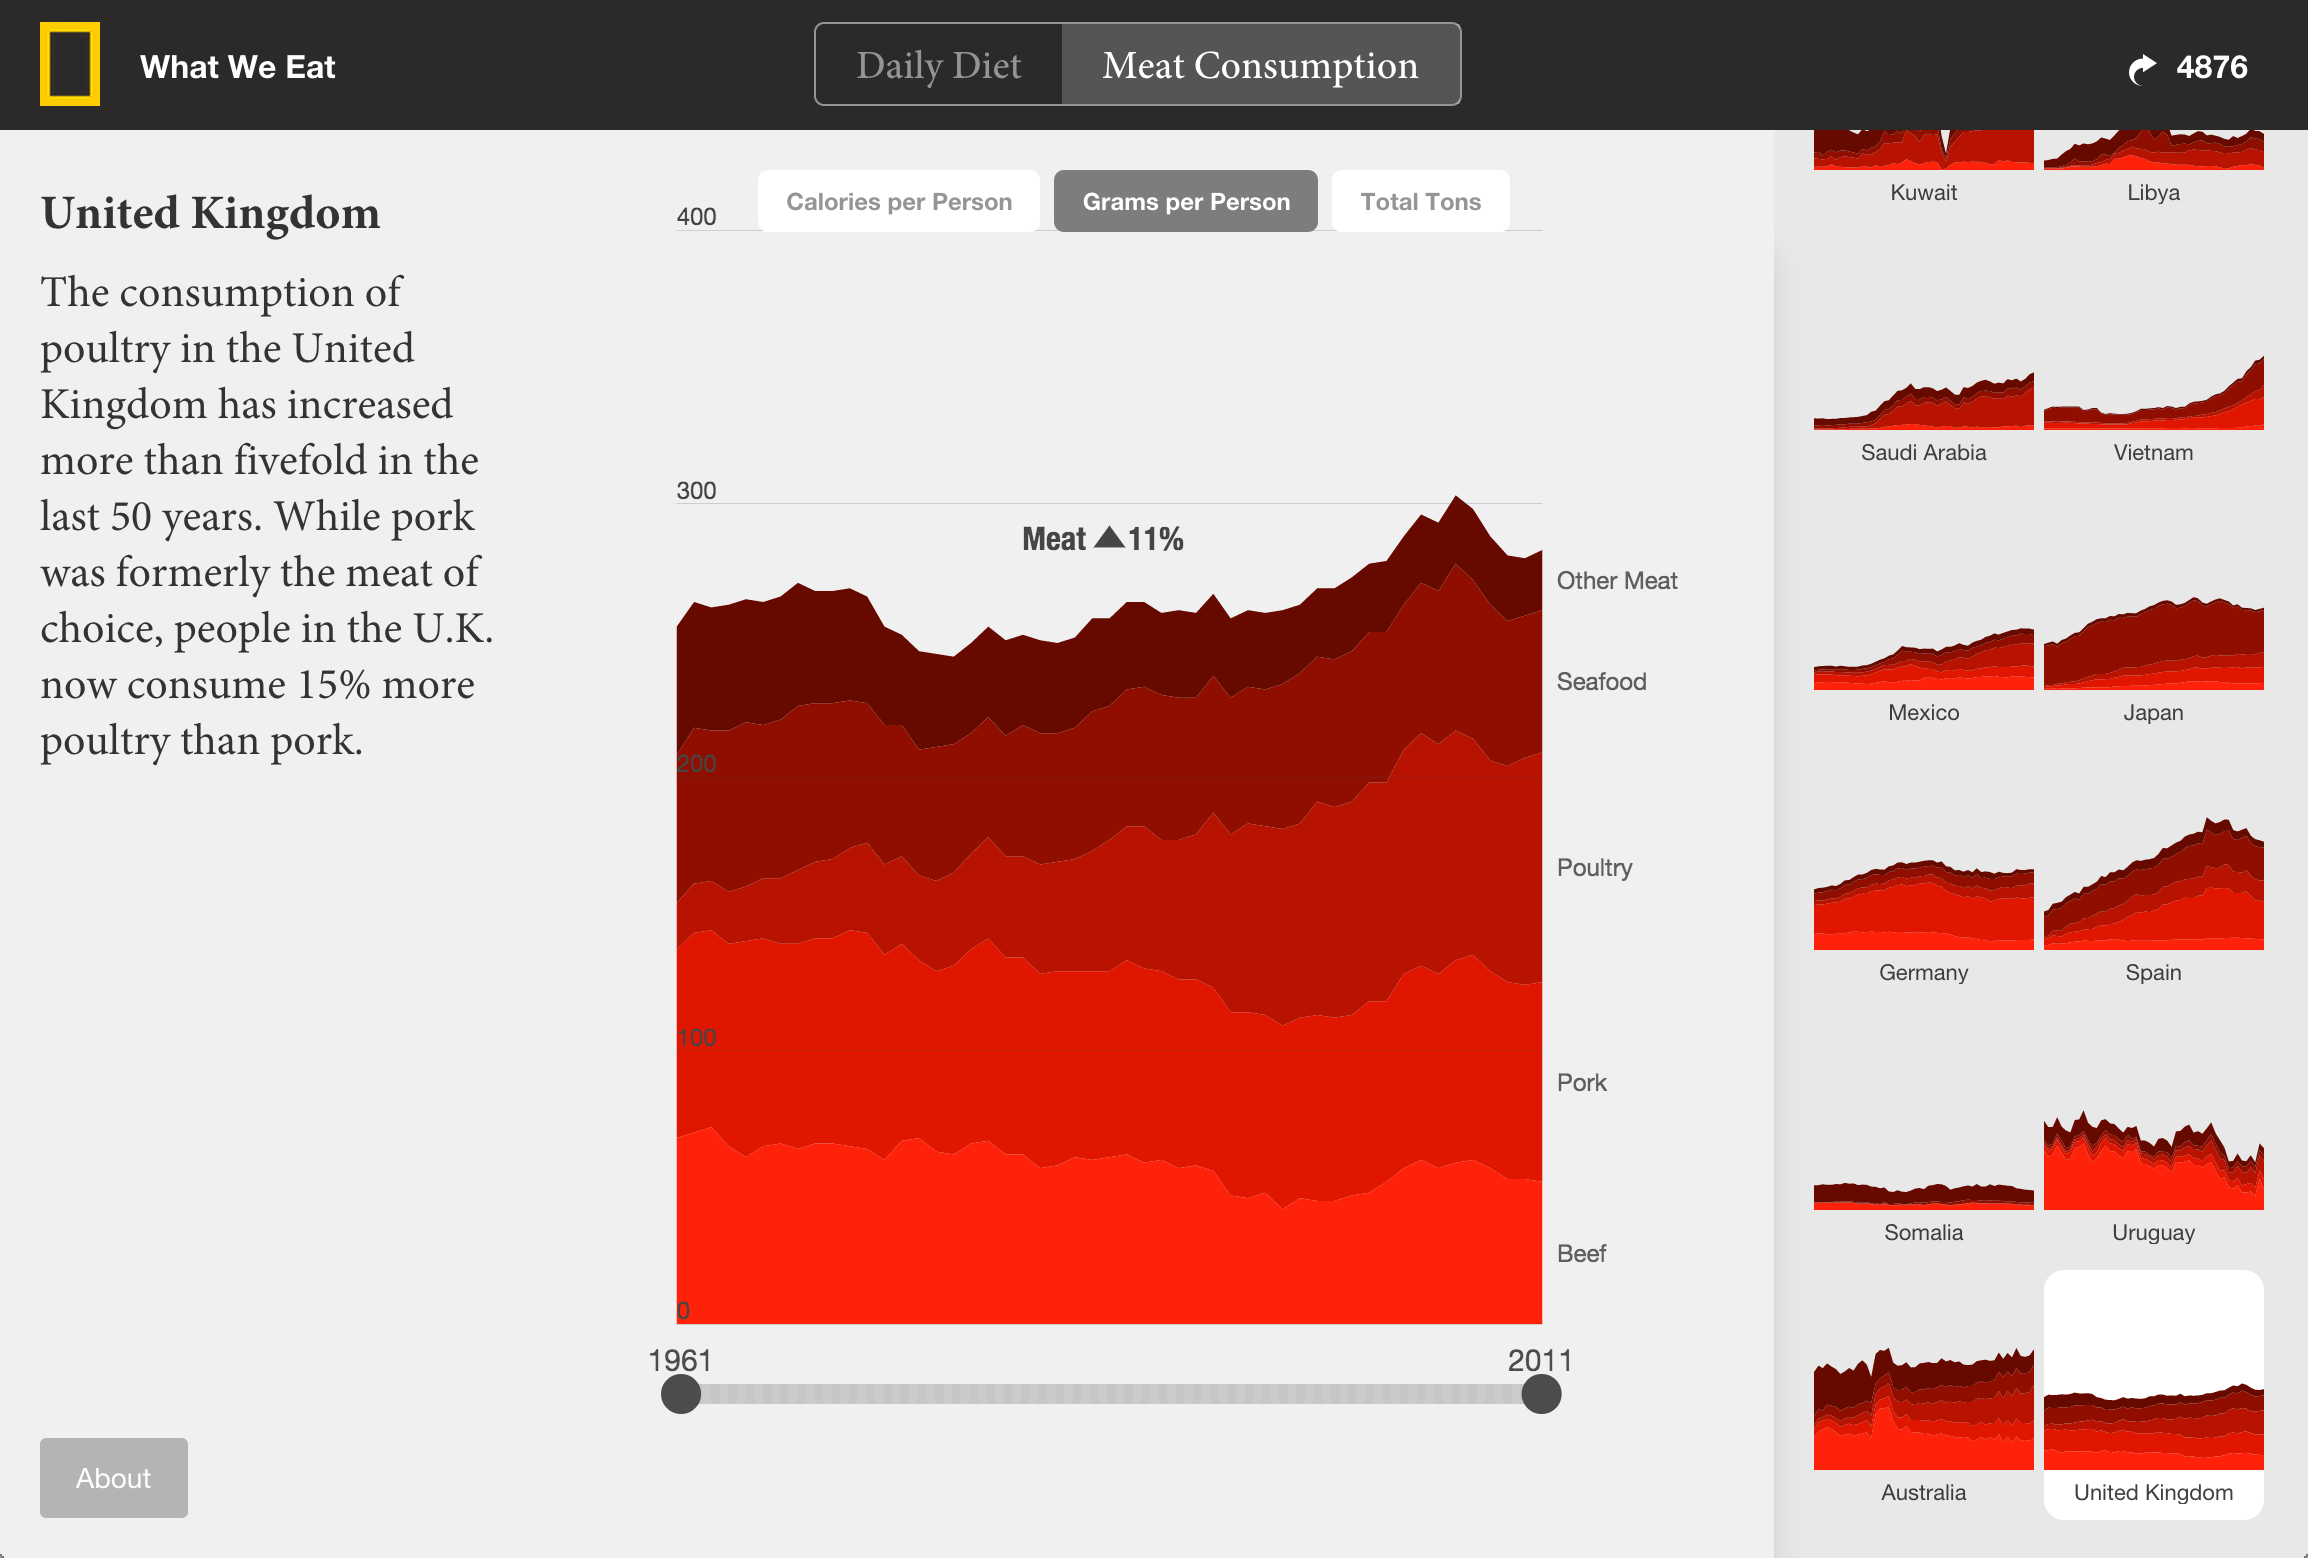
To this end the diet and meat consumption of more developed places like the U.K. have remained relatively unchanged, while the influx of China’s population and economy has led to unrivaled growth in both national and per person meat consumption.
Visit the site to explore the data, compare consumption across countries, and learn about the factors that influence the way people eat around the world.
We’d love to hear what you’re working on, what you’re curious about, and what messy data problems we can help you solve. Drop us a line at hello@fathom.info, or you can subscribe to our newsletter for updates.