All these recent changes prompted us to wonder how they change the culture of Boston, and what that means for the people who were already living here. We were curious about how a data driven story could complement narrative stories and observations of how Boston has changed recently. We were especially interested in what this means for social and economic inequality within Boston, and how that has been changing recently.
But it wasn’t enough for us to look at summary statistics of Boston as a whole — that type of aggregation hides the nuances of inequalities between neighborhoods. To take this further, we wanted to understand how Boston neighborhoods have changed over time, in recent history.
How has Boston changed over time?
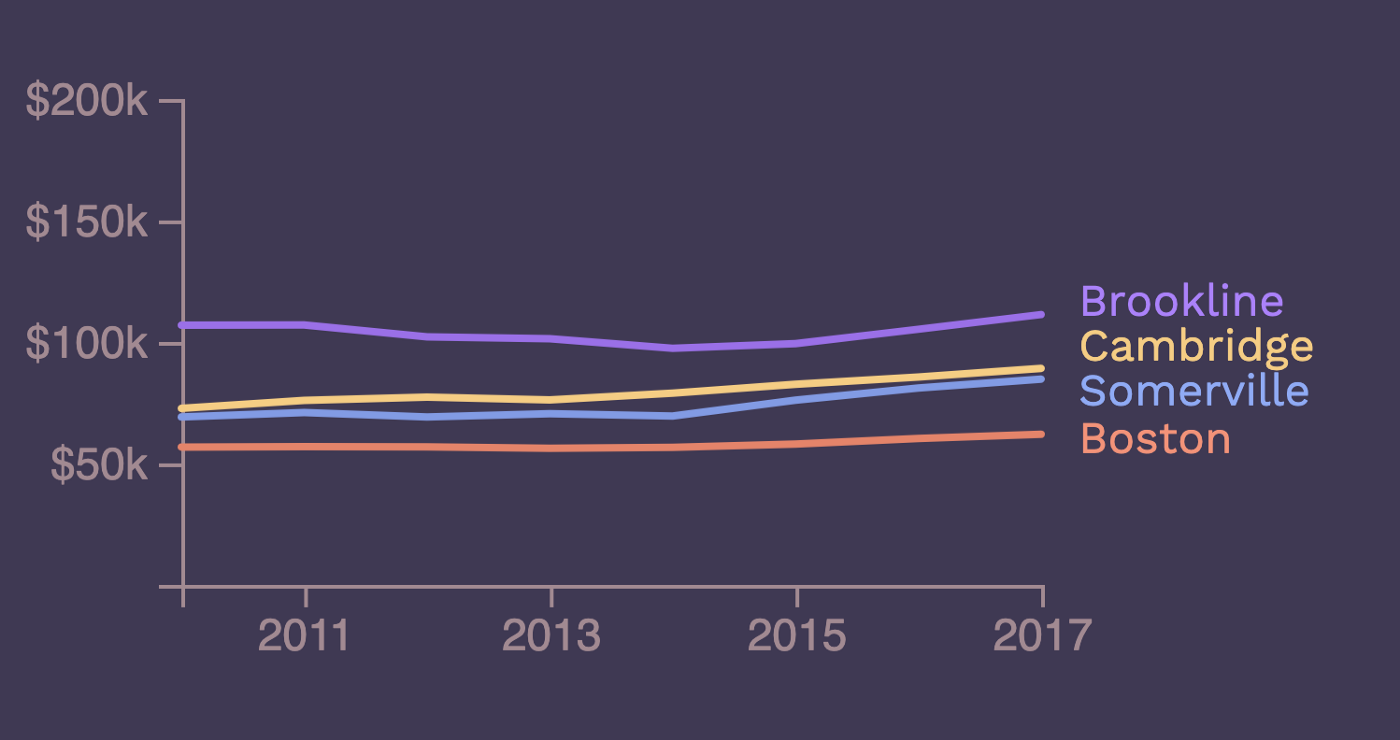
Boston has long been regarded as a desirable place to live and work. Over the past decade, the city’s growing economy has attracted numerous companies and high-paying jobs. These trends are evident when we look at the change in median income of Boston and its surrounding cities since 2010 — each city shows a clear increase in median income over time.
But looking closer, these increases are not actually felt by everyone. This bar chart shows the distribution of people with different income levels.
It’s not a subtle shift where everyone has seen their income increase slightly. Since 2010, the percent of households who make over $100k has jumped from 24% to 33%. This is the result of people moving into the city to fill the new high-paying jobs. There’s more evidence of this when we look at a map of Boston neighborhoods over time.
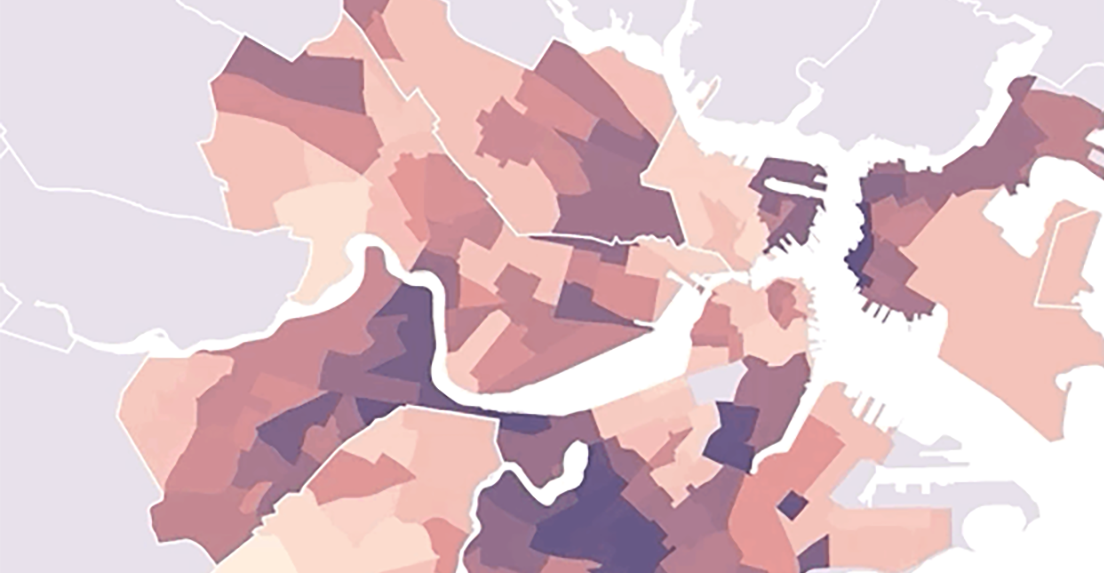
Geographic Inequality
This map shows the median income for each neighborhood in the Boston area. Although inequality has always existed, more of Boston was close to the median income in 2010. In only 7 years since then, there is an even starker gap between areas of high and low income. Not all parts have Boston have seen increased income as the Boston economy has grown.
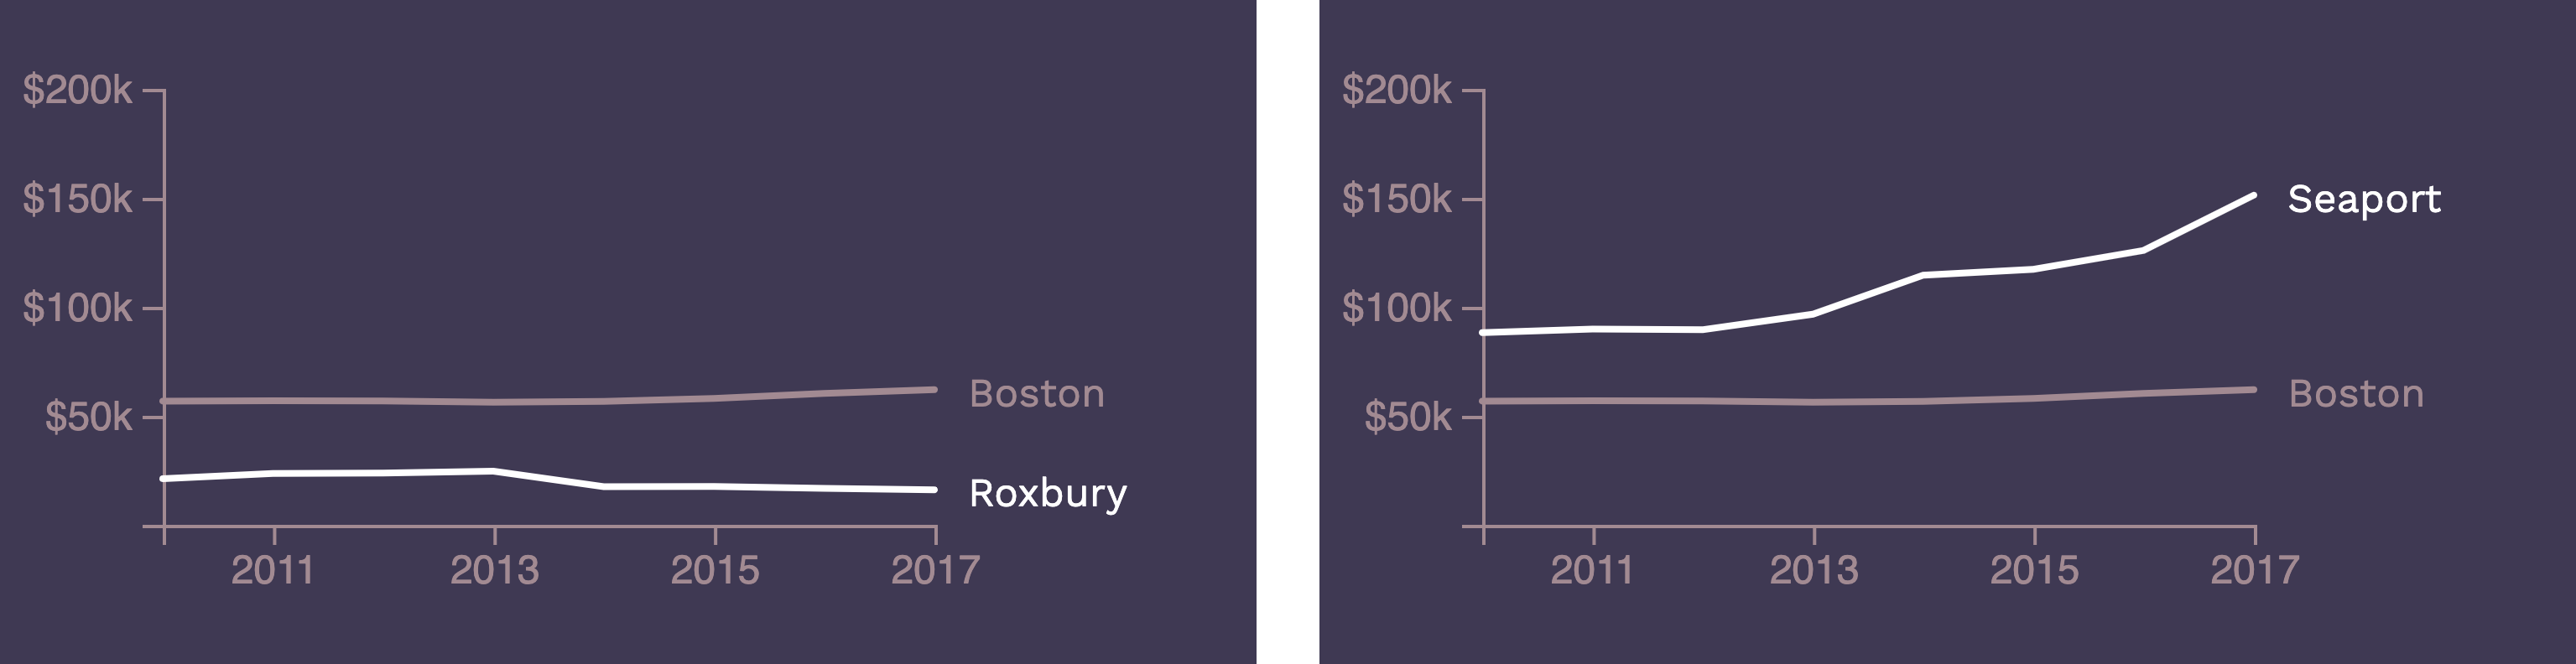
This map starts to illustrate how inequality manifests itself in Boston, but this disparity is even more clear when comparing different neighborhoods in the city. Below, the charts compare income in Roxbury and the Seaport to the median Boston income. The seaport district has recently been developed with a large influx of companies and luxury housing, a trend very evident in the median household income there. But while these resources were put into the Seaport, many other parts of Boston have not benefited from Boston’s increased jobs. Incomes in Roxbury have remained low over this time period, or even dropped slightly in this neighborhood of Roxbury. This income inequality is also tied to eviction rates, as low income areas such as Roxbury are facing much higher rates of eviction.
Even in areas with slight increases in median income, it doesn’t mean that people in the neighborhood are all doing slightly better. For example, in Chinatown, the median income has gone up because more people making over $100k have moved into the neighborhood.
Chinatown also happens to be one of the densest parts of Boston with high levels of inequality. What happens to communities like this with an influx of people with high paying jobs? In a very dense city with a housing crisis, what does this mean for those who are pushed out? The displacement mapping project incorporates stories about Boston residents, including from Chinatown, who have been displaced from their neighborhoods as areas have been developed. These stories provide context for understanding how these recent changes have affected people’s lives.
Race and Inequality
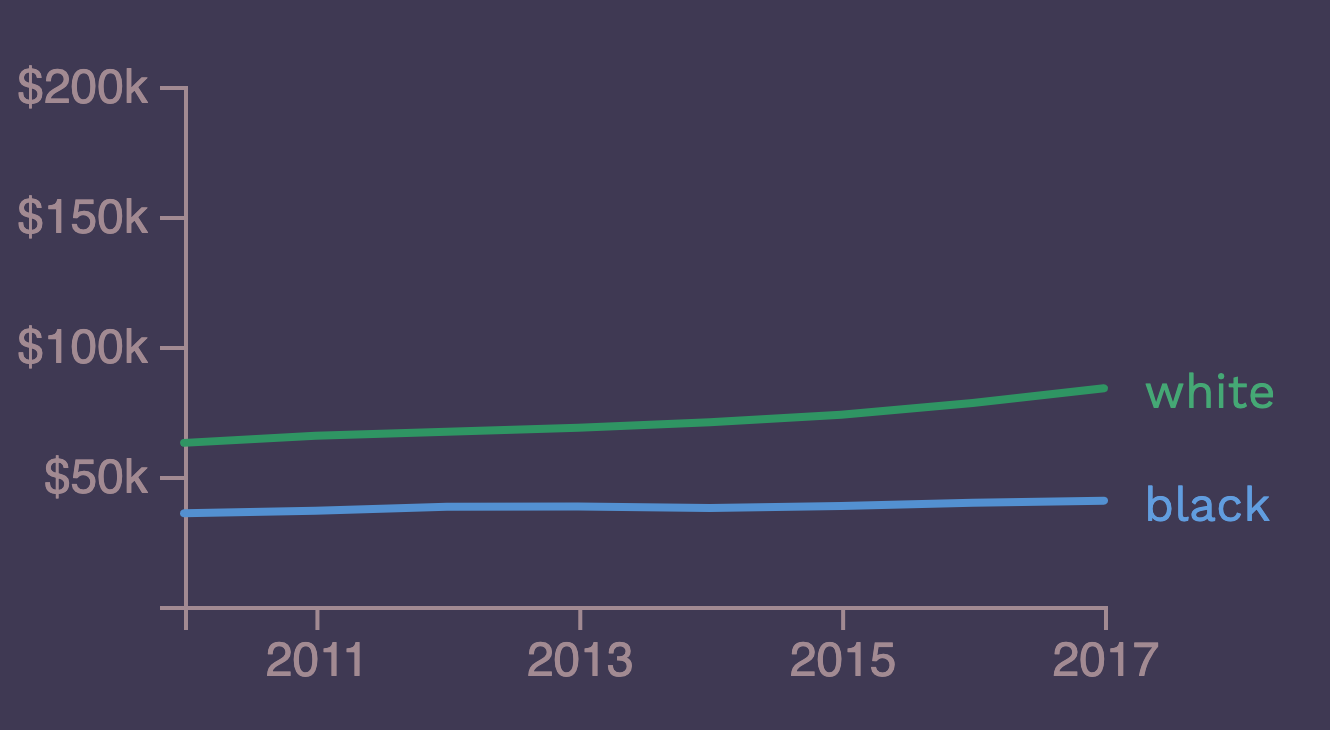
Income alone does not show the whole picture. Different types of inequality often compound, resulting in more stark effects on people. Race and racism have long affected income inequality, with black folks consistently earning less and having less economic mobility than white folks. Boston is no exception. Although Boston’s overall income has increased, the gap in median income by race has widened over time as seen in the graph below.
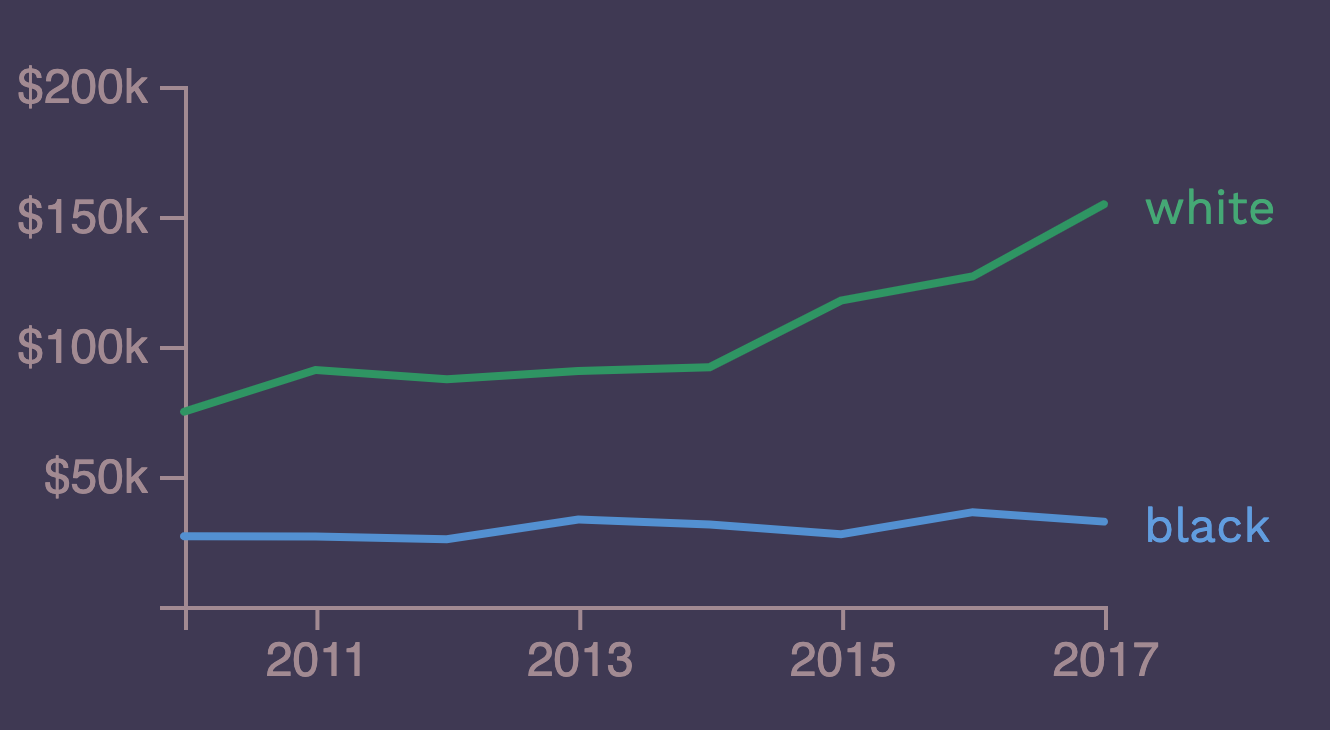
In Cambridge, near the neighborhood where I grew up, this divide has become even larger. As a result, the many effects of inequality — access to educational opportunity, health outcomes, exposure to environmental hazards, for example — also fall along race lines, increasing disparities between people.
Education and Inequality
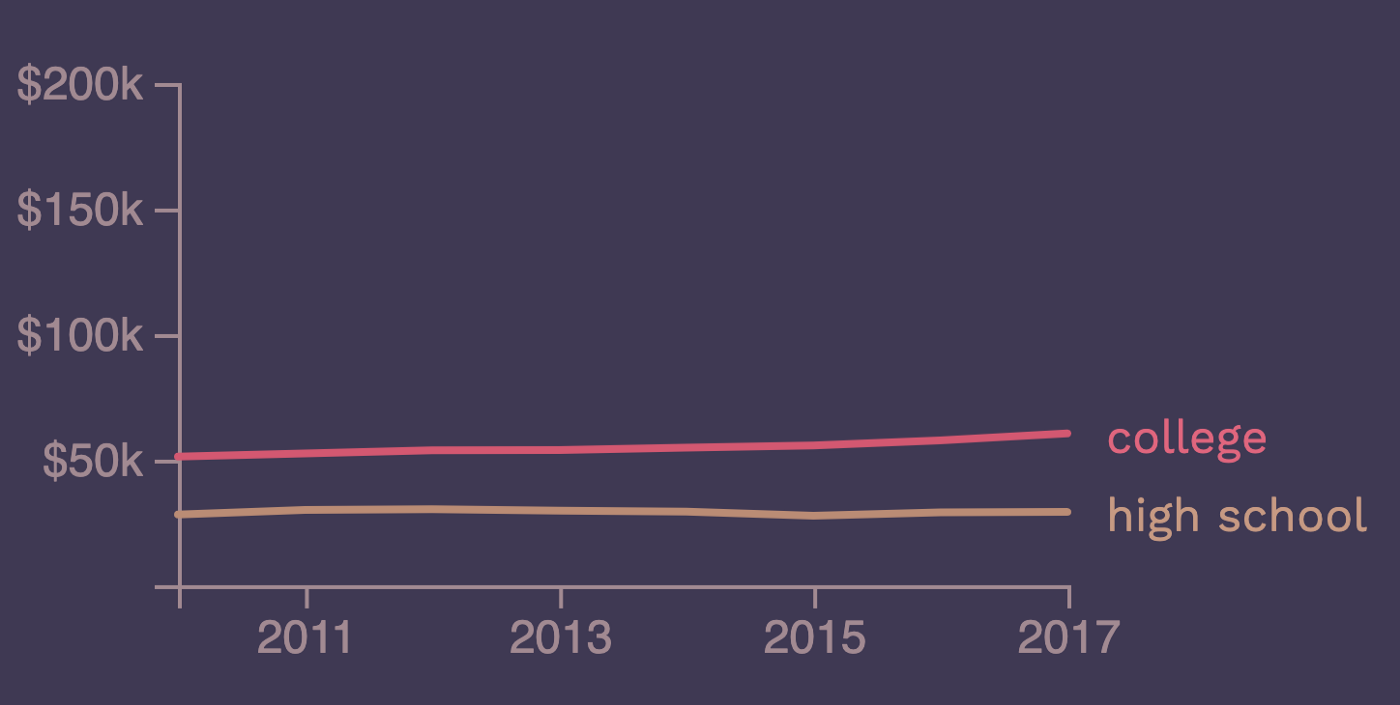
Education has often been portrayed as a way to overcome these disparities. In Boston as a whole, this trend holds true, and people with a college degree earn more than people with only a high school degree. However, higher education does not benefit everyone equally, as people of color make less than white people with the same level of education.
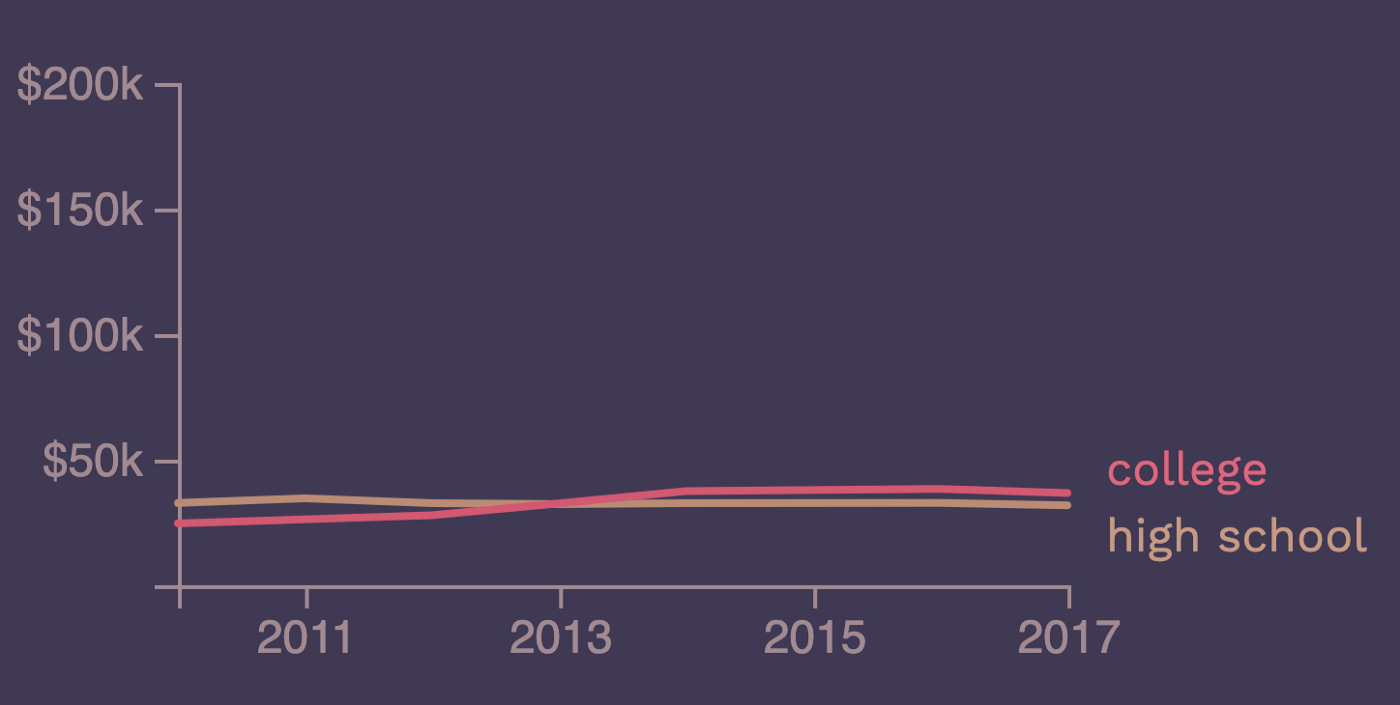
Even in Boston, a city of universities, there is an uneven distribution of educational attainment, and a college education does not guarantee higher salaries. East Boston has historically been a place where immigrants and working class families live. In this neighborhood in East Boston, there is very little difference in income between people with a college degree and a high school degree. For people living here, education has not lived up to the promise of economic mobility.
Explore the Data
What is the history of your neighborhood? How are the changes you’ve witnessed reflected in data? We built a tool for ourselves to help understand what’s really happening in our city. We hope that by making the information more accessible, we can start asking more informed questions about how we want to build the future of Boston. You can explore the full data below.
See the Pen Boston Median Incomes by Anisha (@anishan) on CodePen.
About the Data
The American Community Survey, collected through the Census Bureau, is an ideal source of data for consistently measuring indicators over time. We focused on median household income, and how this compares between people of different races, education levels, and in different neighborhoods. In order to get the data with the detail of neighborhoods, we used the ACS 5-year survey, which means data collected and aggregated over five years for better accuracy. (So for the 2010 data, the data was collected between 2005–2010). This data is collected at a national level, so it also allowed us to look at the entire Boston area, not just the city of Boston, for a more holistic picture.
We’d love to hear what you’re working on, what you’re curious about, and what messy data problems we can help you solve. Drop us a line at hello@fathom.info, or you can subscribe to our newsletter for updates.