
The week consisted of lectures, presentations, and hands-on coding assignments in p5.js. As a diverse team with backgrounds in computer science, design, and web development, we all had loads of fun learning from each other and creating together.
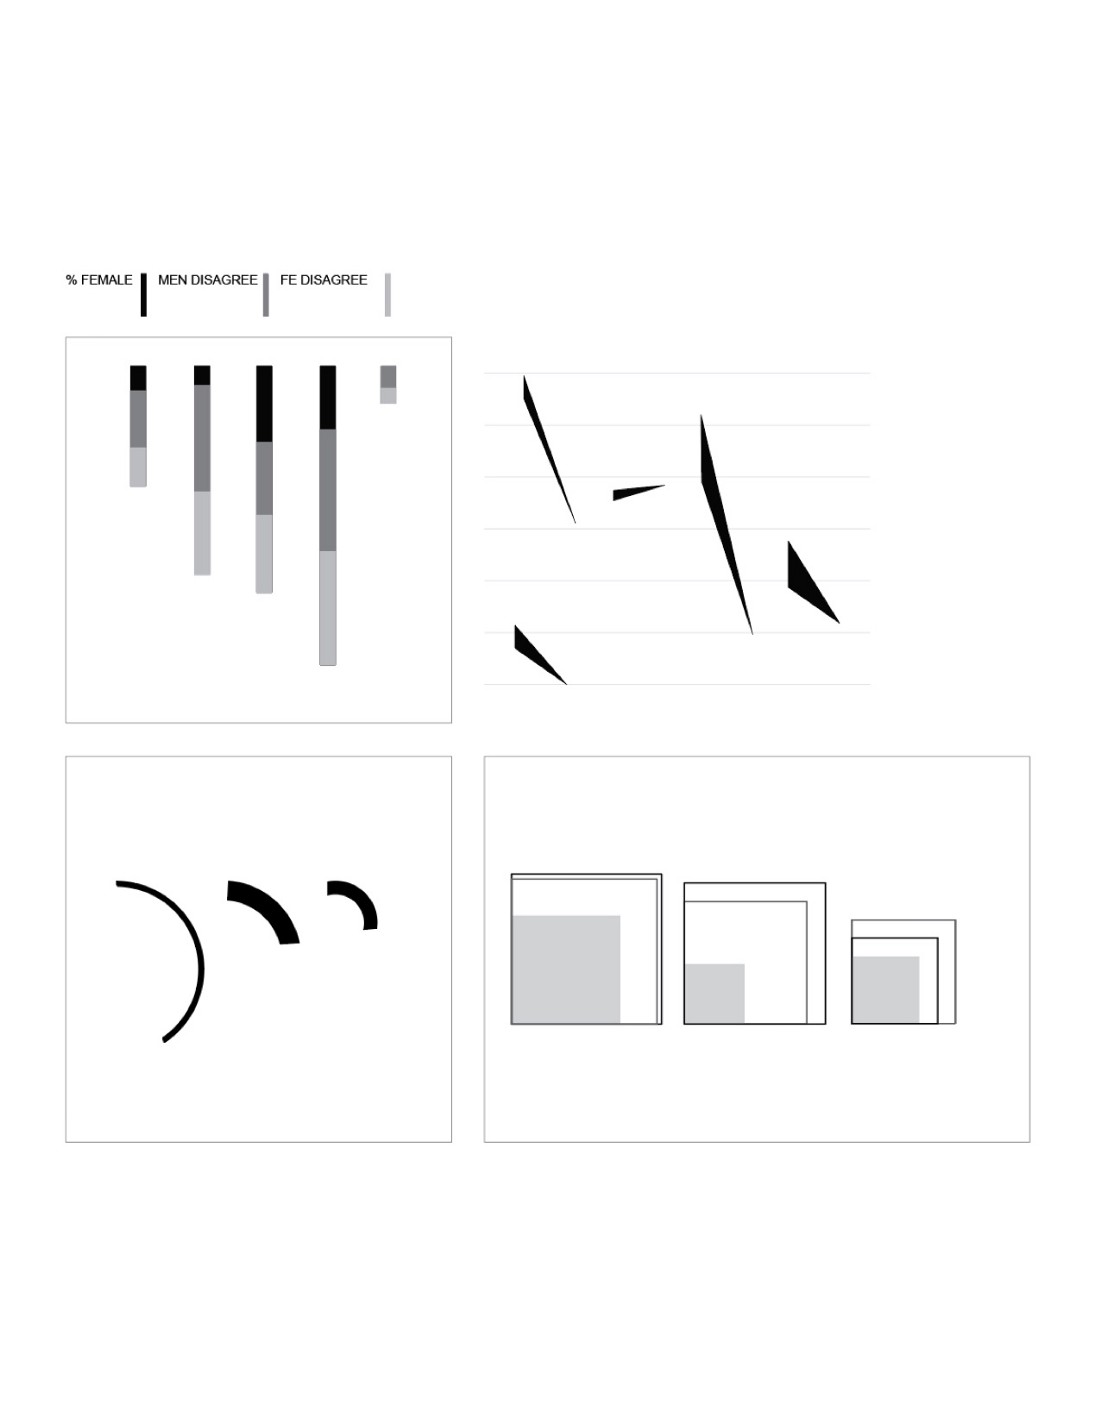
Our first assignment was to design abstract representations of time. After gathering inspiration from previous students’ designs and experimenting with their code, we set out to design our own. We each came up with at least six different concepts and chose the best three to build from scratch. Our process began with sketching ideas on paper before we started coding.
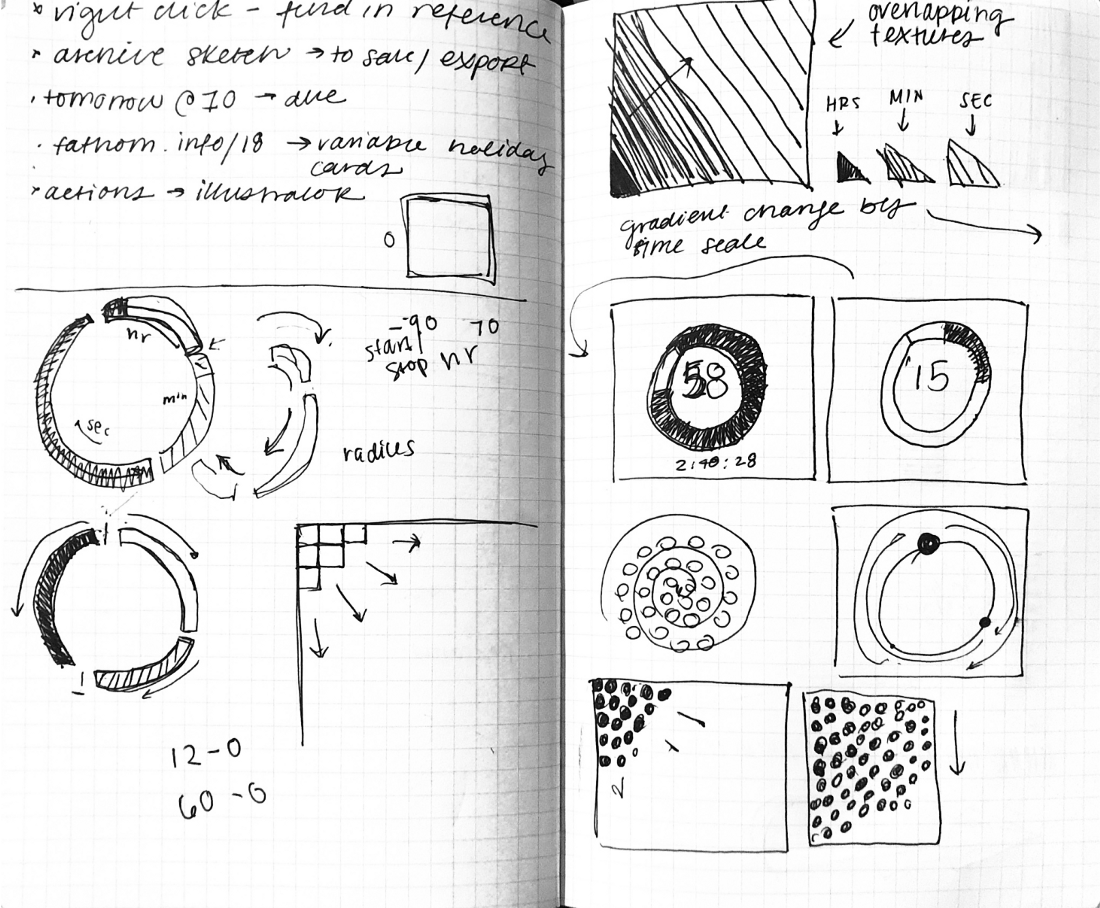
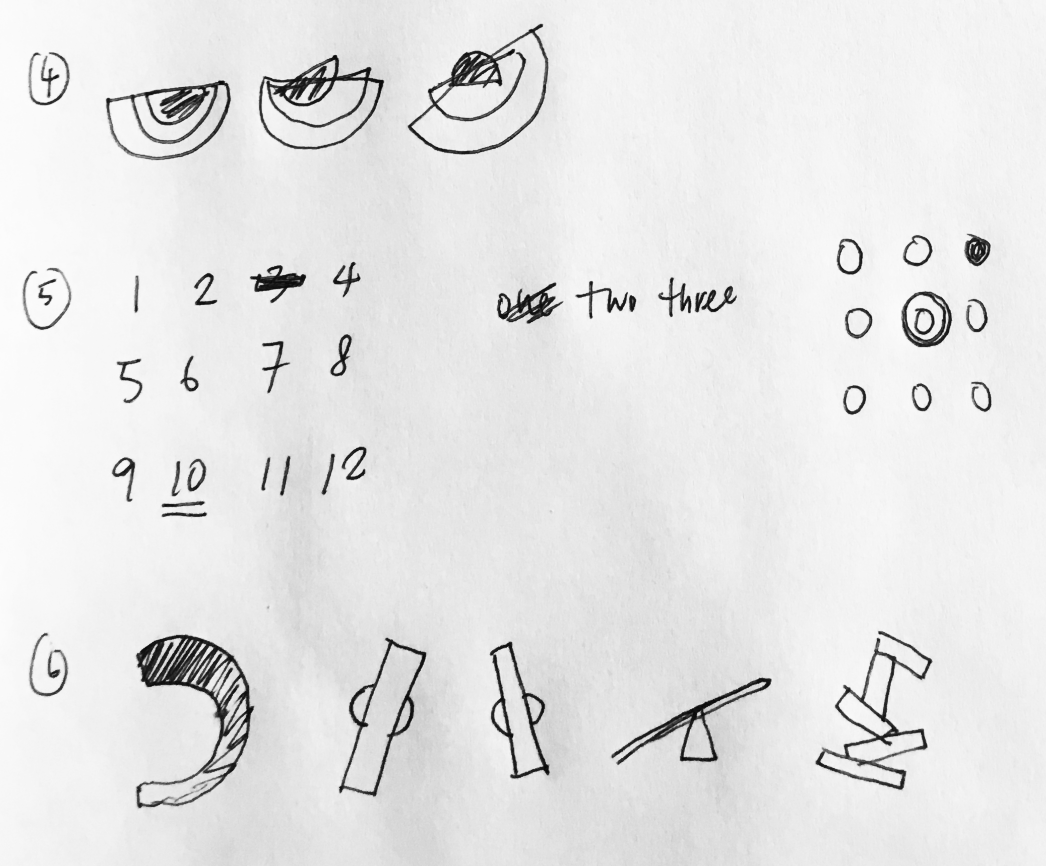
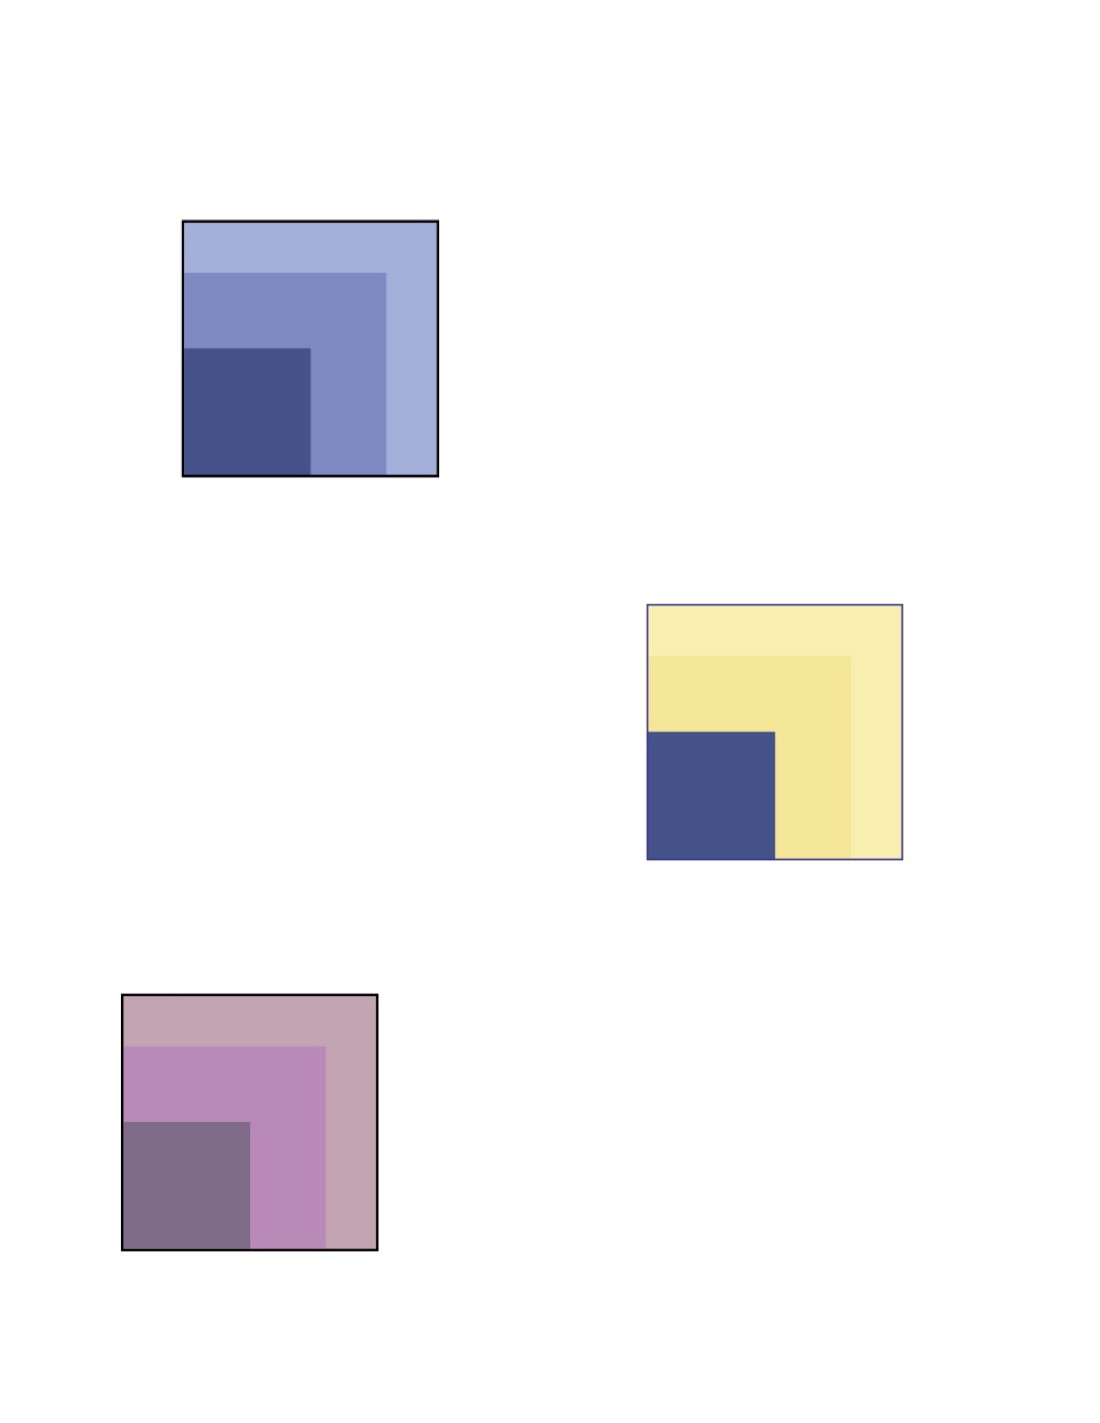
Below are some of the final clocks our class came up with. We experimented with orientation, shape, texture and re-inventing the wheel (literally).
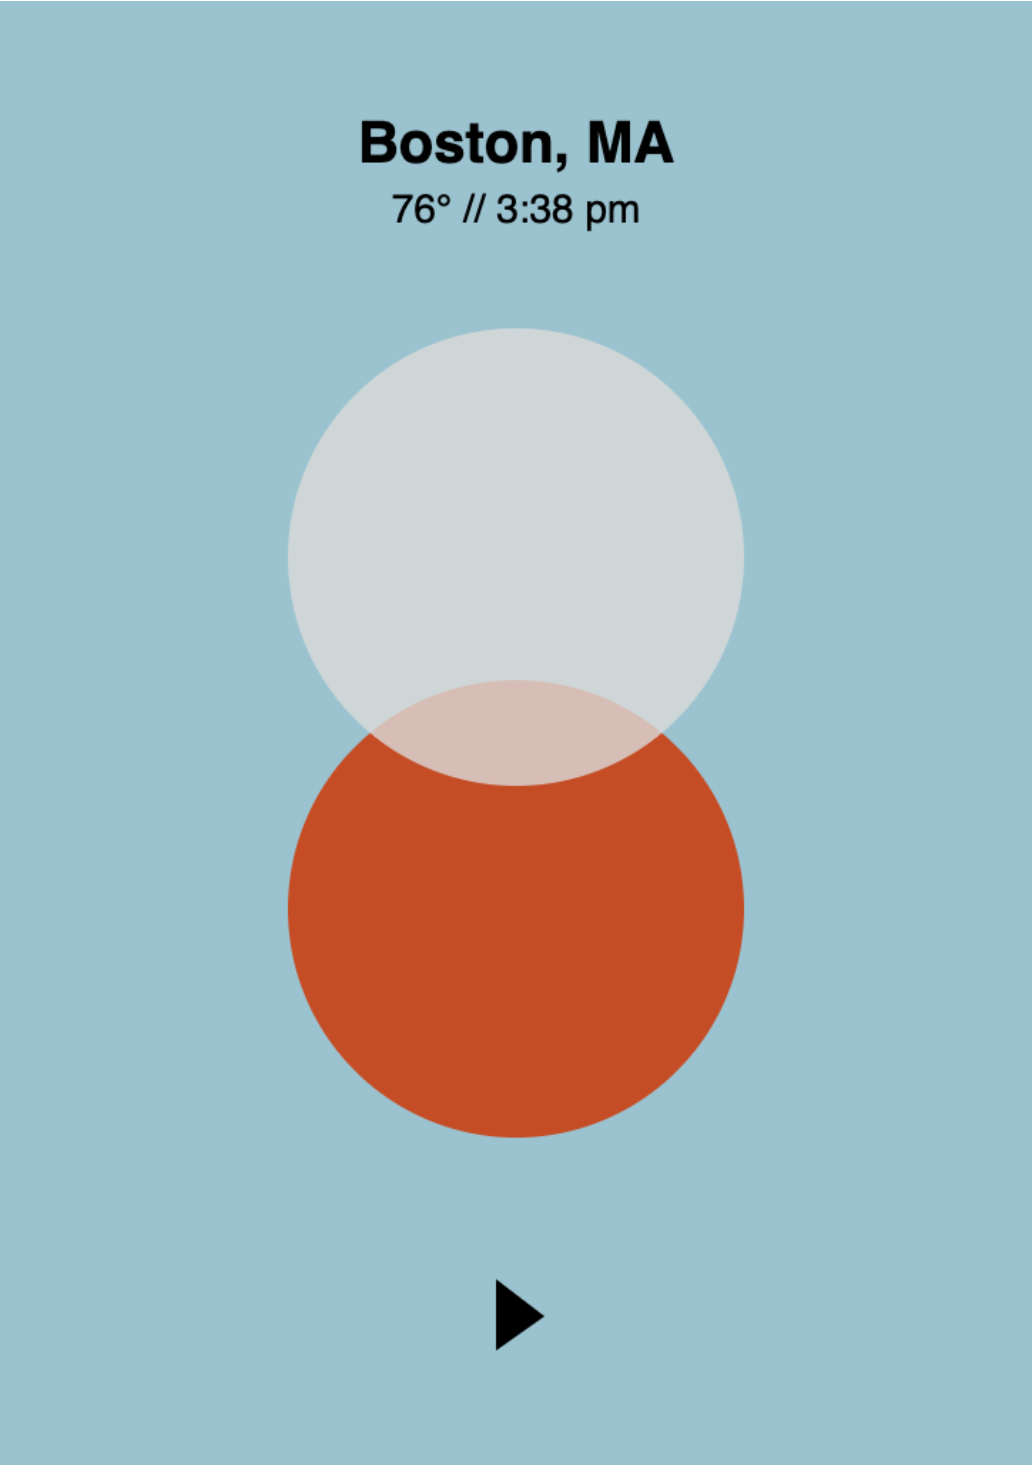
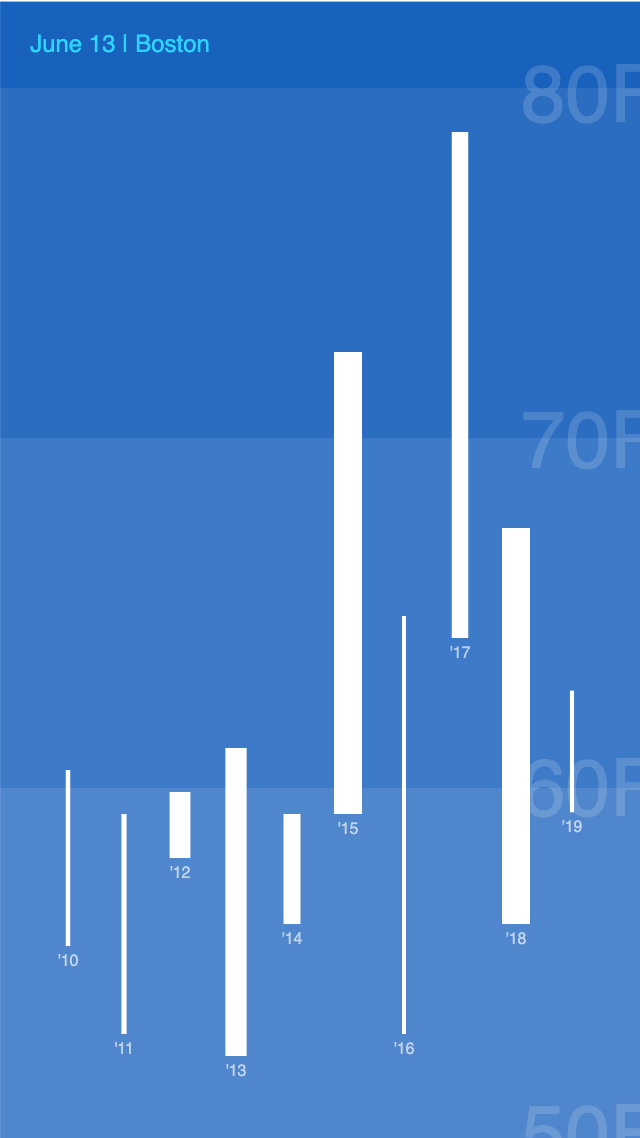
Our next task was to re-imagine mobile weather apps. Using real time weather data gathered from Dark Sky’s API, we created abstract and literal weather apps for different audiences and uses. The designs included an elegant visualization of cloud coverage, a historical weather app, and an abstract wind speed tracker.
After finishing our weather apps, we took a quick step back from coding and dove into storytelling and narrative. We started by watching talks by Hans Rosling, Daniel Mallory Ortberg, and Nate Stanton to spark our thinking about how to communicate strong narratives using different modes of storytelling. We then had a guest presentation from our very own Elaine and Olivia, who explained their process of extracting narratives from large sets of data while working on Fathom’s No Ceilings project.
After exploring the No Ceilings website, we split into groups and each created a 90 second presentation telling the story of one or a few indicators from the data set. This challenged us to pull out a narrative thread and refine it for our audience. The time-limit required us to think critically about what story we wanted to tell and how we would communicate it effectively, and made us constantly check that our narrative was accurately representing the data.
By Friday, we had the chance to combine all the skills we had developed during the week—coding, design, and storytelling — into one final project. We split into 2 groups and each created an interactive piece using the narrative we had created for the 90-second presentation.
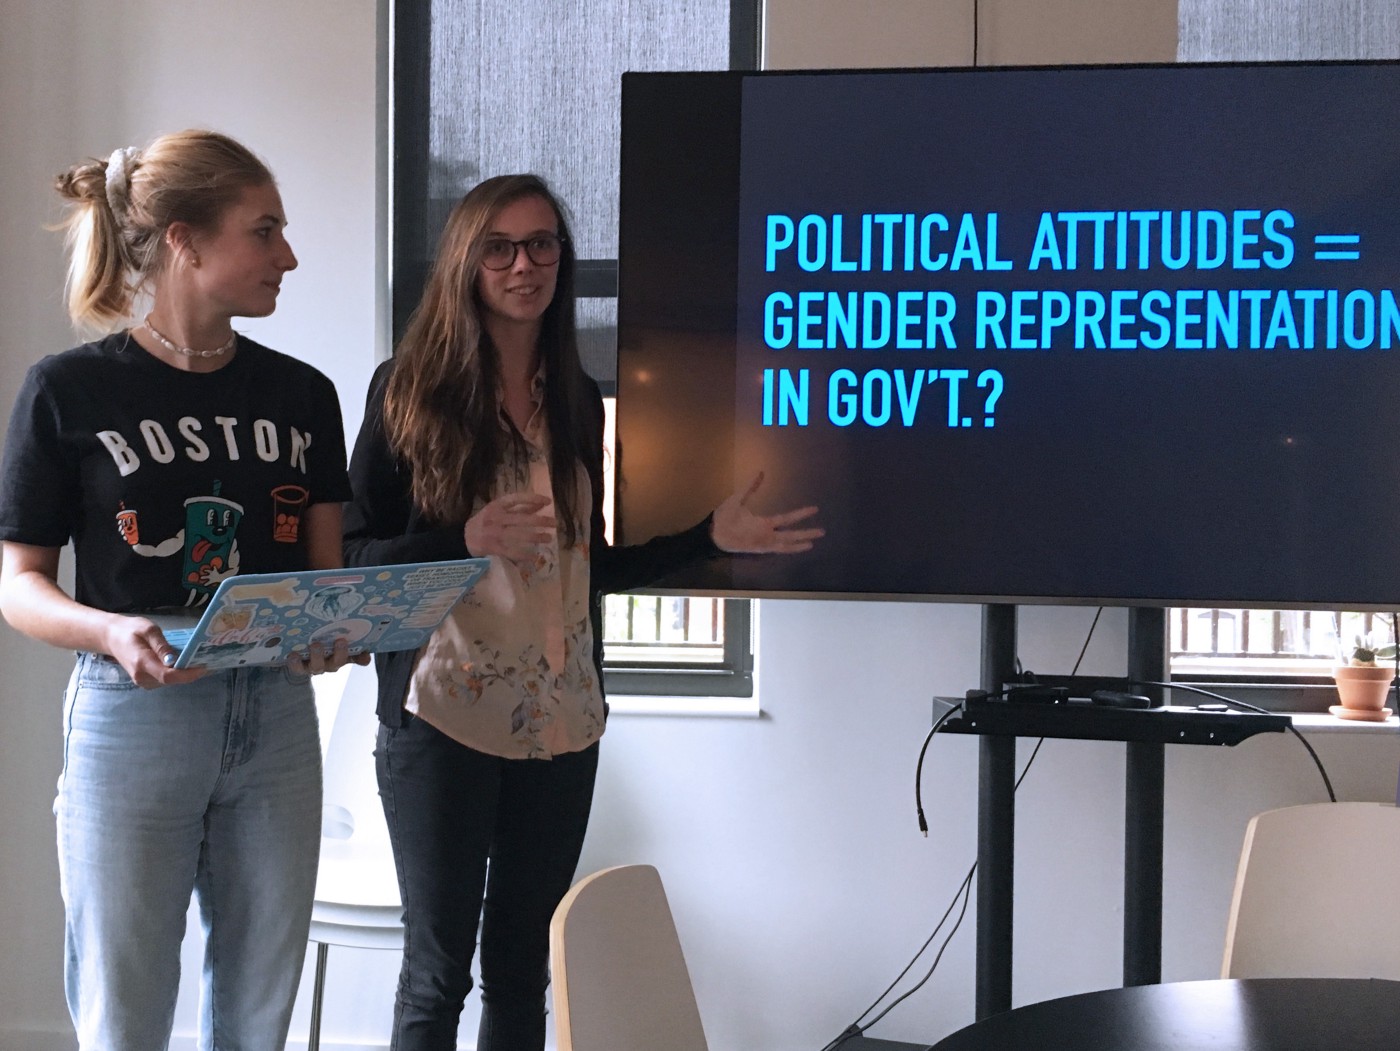
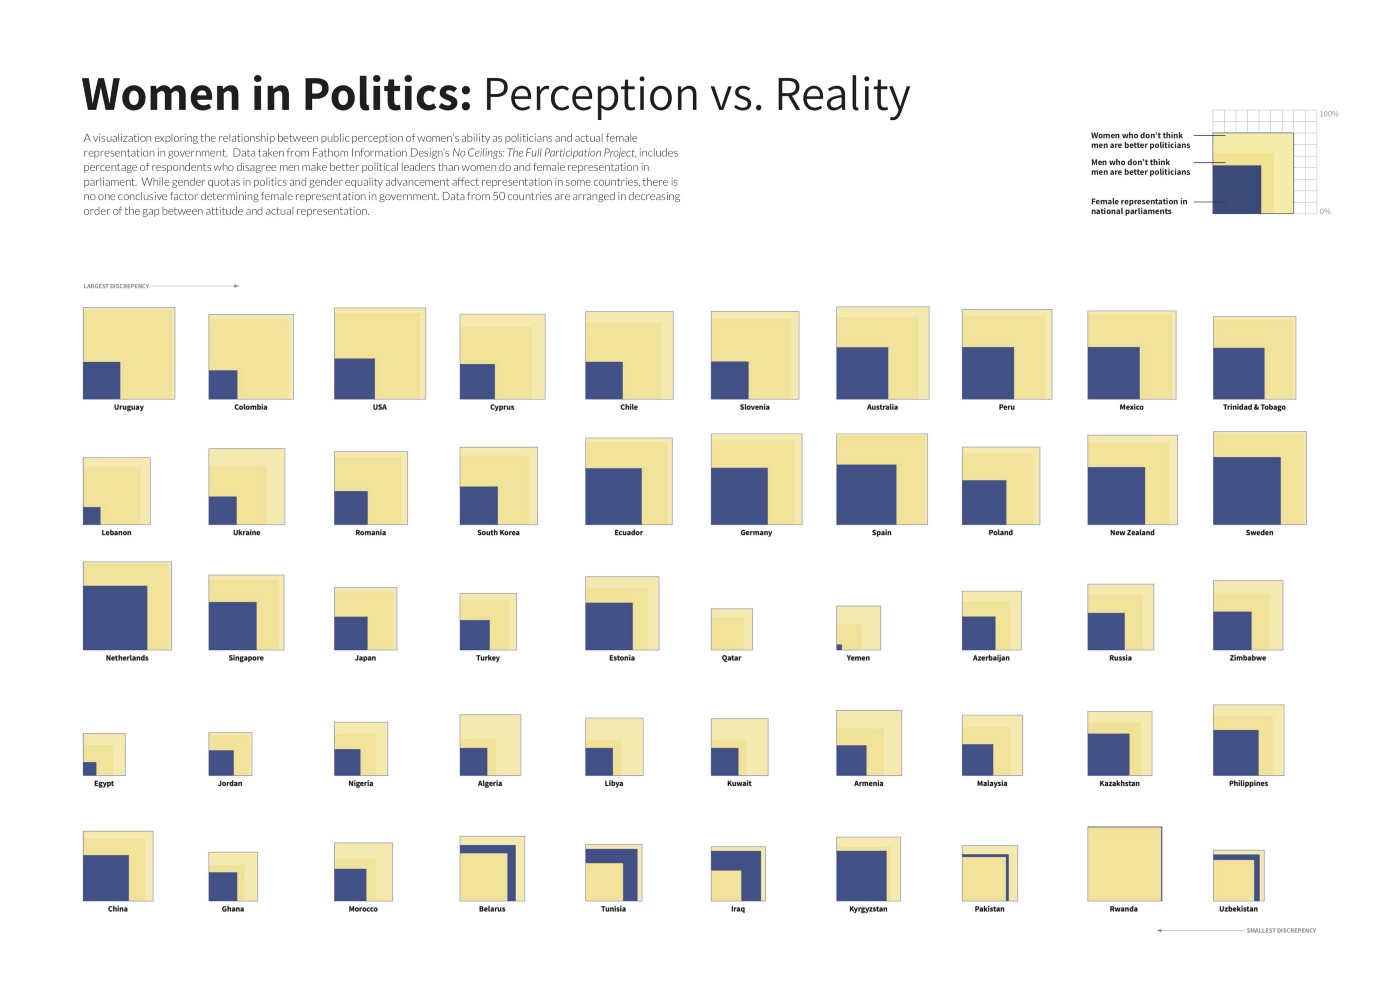
One group explored the relationship between political attitudes and gender representation in government. They found that many countries have a large discrepancy between the percentage of people “that disagree or strongly disagree that men make better politicians than women” and the percentage of female representation in government. Their data suggested that though a majority of people say they believe women make good politicians, they still don’t seem to vote for them. They created an interactive essay exploring the data as well as a poster.
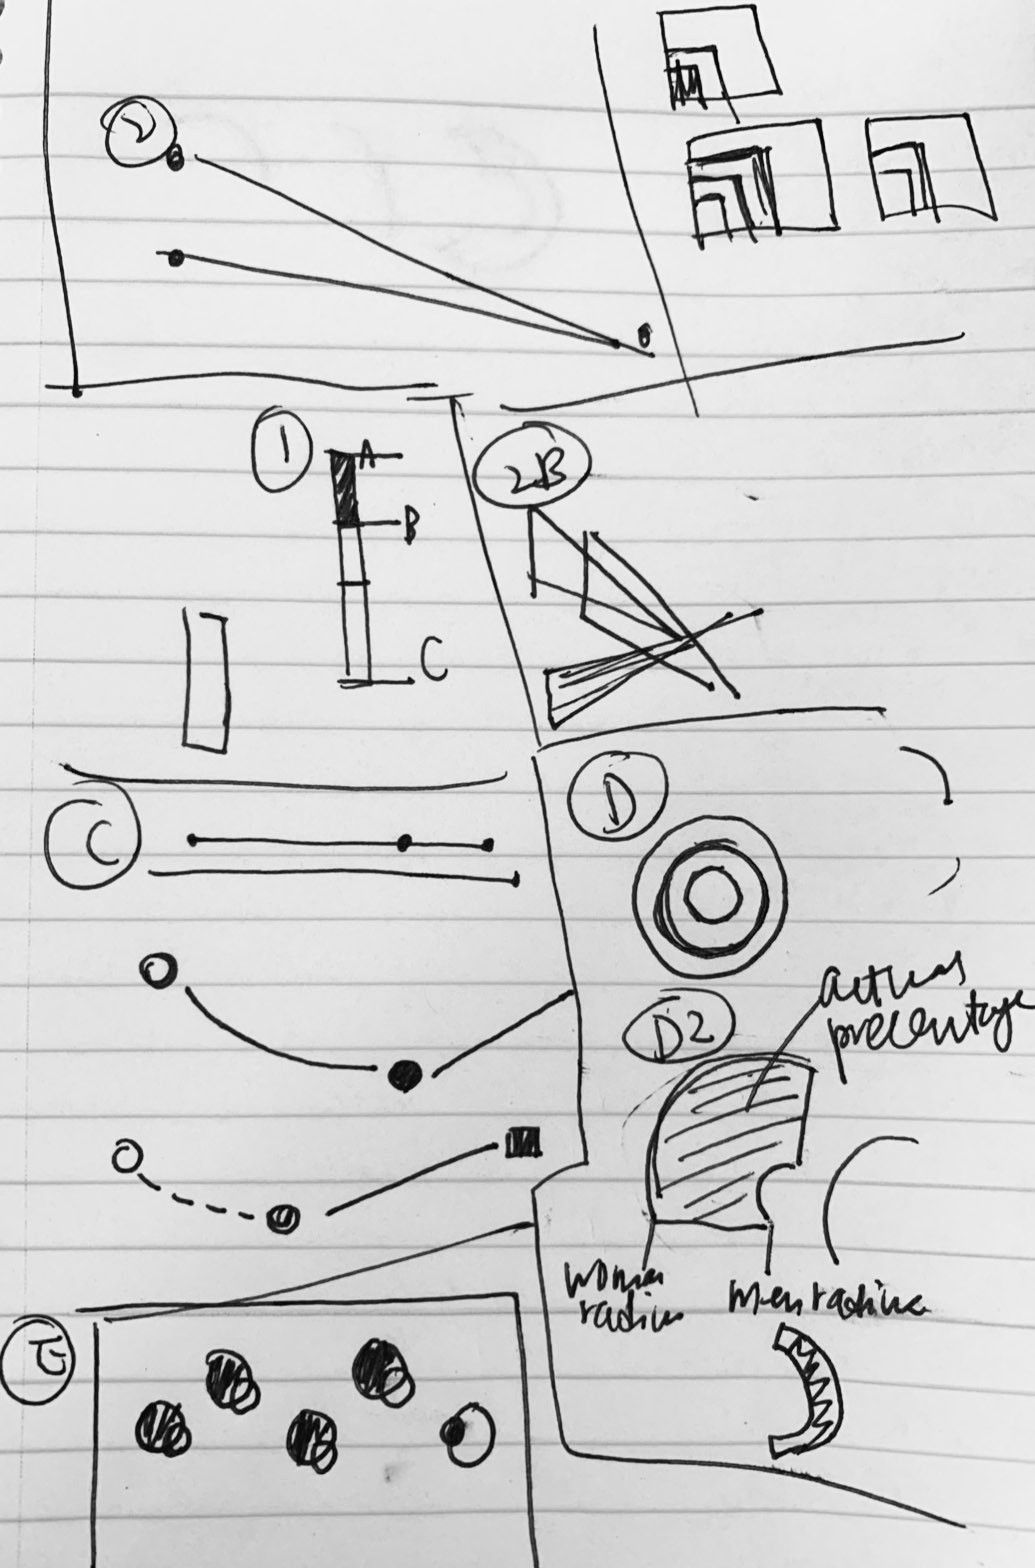
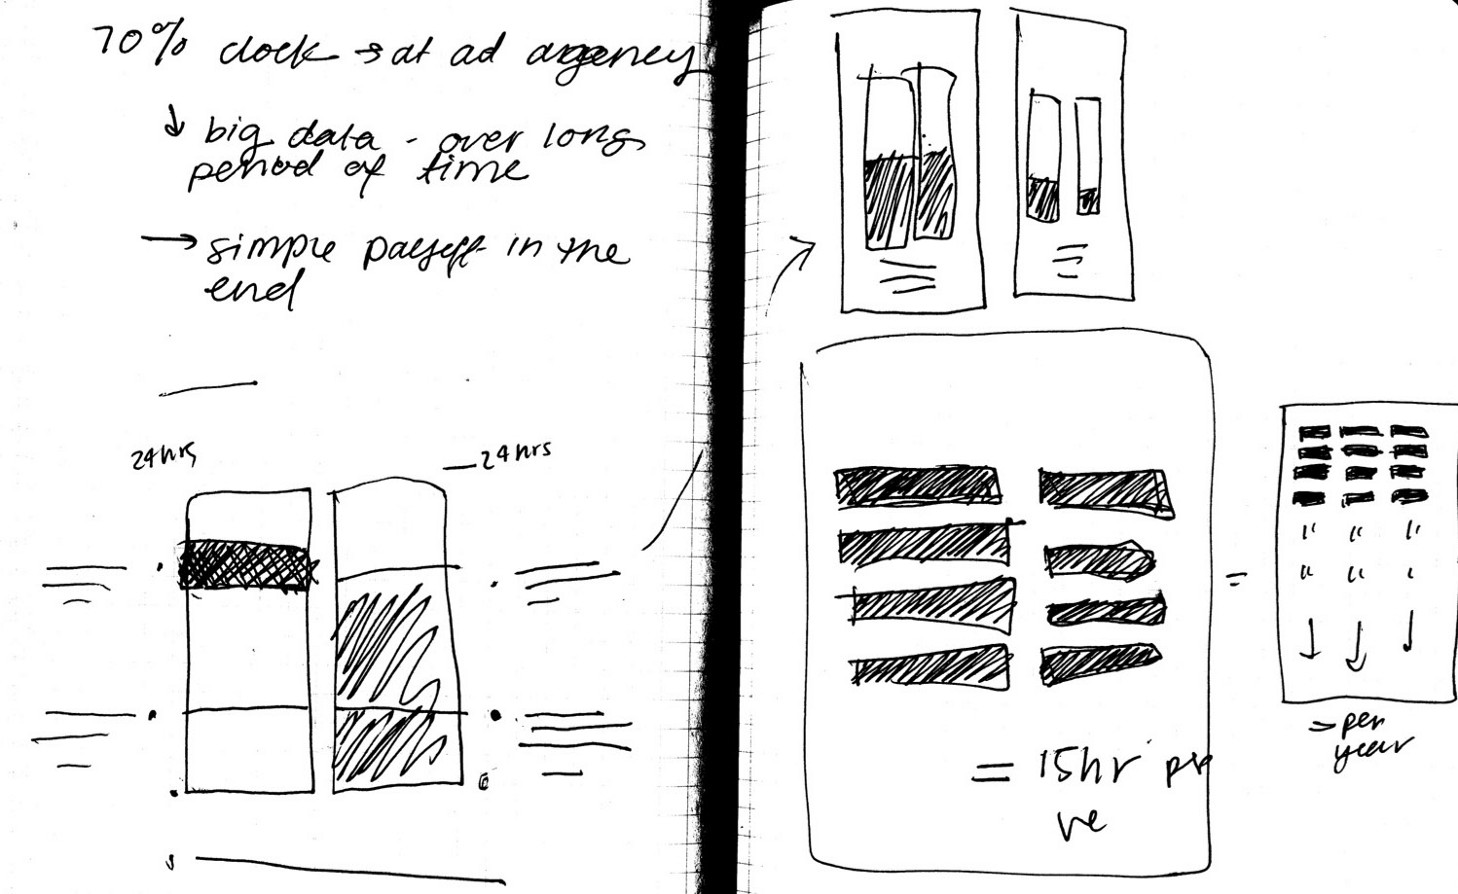
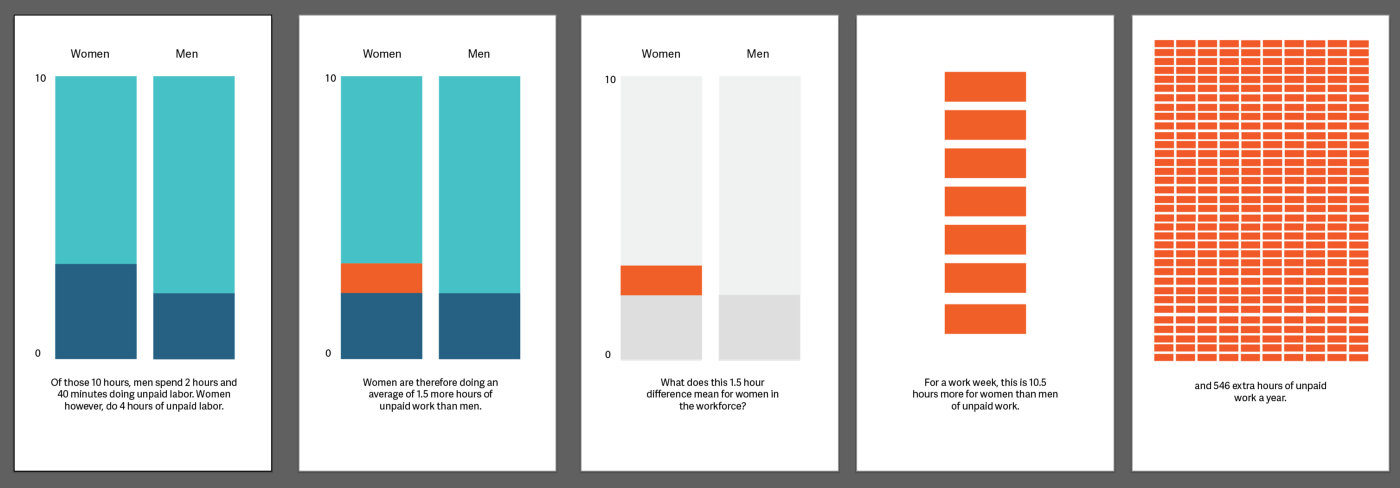
My group explored the indicator of “minutes of unpaid labor.” We found that on average women spend 1.5 more hours performing unpaid labor than men. We were interested in visualizing this difference, and using a sketch from our presentation as a jumping-off point, created a mobile animation that told the story.
The class was a great way for new team members at Fathom to experience the fluid and unique method in which we work, integrating code, design and storytelling to produce powerful visualizations. Throughout the week, it was especially exciting to see the variety of solutions and concepts that came from a simple (sometimes intentionally limiting) prompt, or just one dataset. As fellow intern Winnie Yoe put it, “coding is magical.” After a week of learning and collaboration, we now present to you the first graduating class of Fathom University (hooray!).
We’d love to hear what you’re working on, what you’re curious about, and what messy data problems we can help you solve. Drop us a line at hello@fathom.info, or you can subscribe to our newsletter for updates.