
There’s a great scene in The Newsroom where a college student in the audience of a Q & A panel asks curmudgeonly TV news anchor Will McAvoy to give a reason why America is the greatest country in the world. After a few facetious half-answers about the New York Jets, the panel moderator coaxes McAvoy into a profanity-laced rant. Why is America the best? “It’s not,” McAvoy snaps. “There is absolutely no evidence to support the statement that we’re the greatest country in the world.”
(Video contains strong language)
While the scene is an entertaining introduction, the issue deserves more attention than five minutes at the beginning of a TV show. Fortunately, Columbia statistician and economist Howard Friedman has already taken a close look at how the United States stacks up against other countries around the world.
In his book The Measure of a Nation, Friedman compares the United States to 13 similar industrial countries using a variety of data to indicate national well-being. He finds that among these competitor countries, the United States doesn’t do very well.

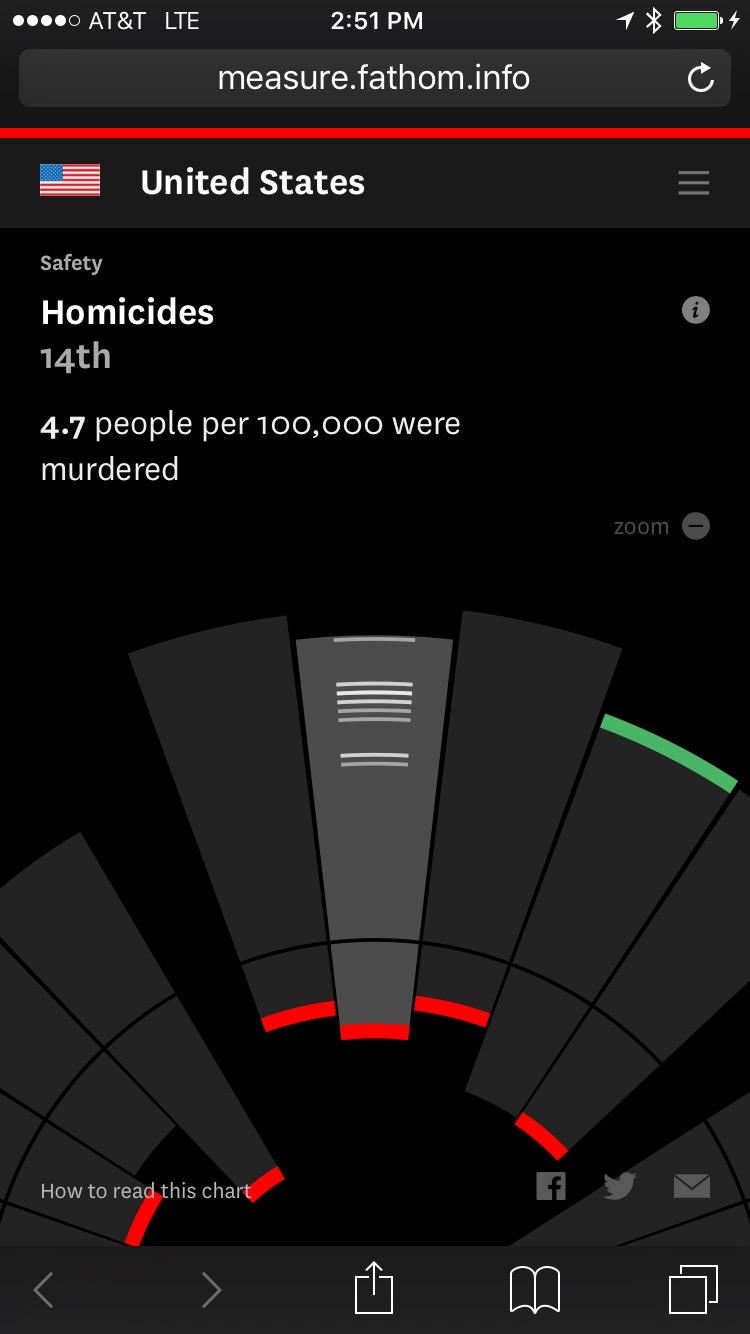
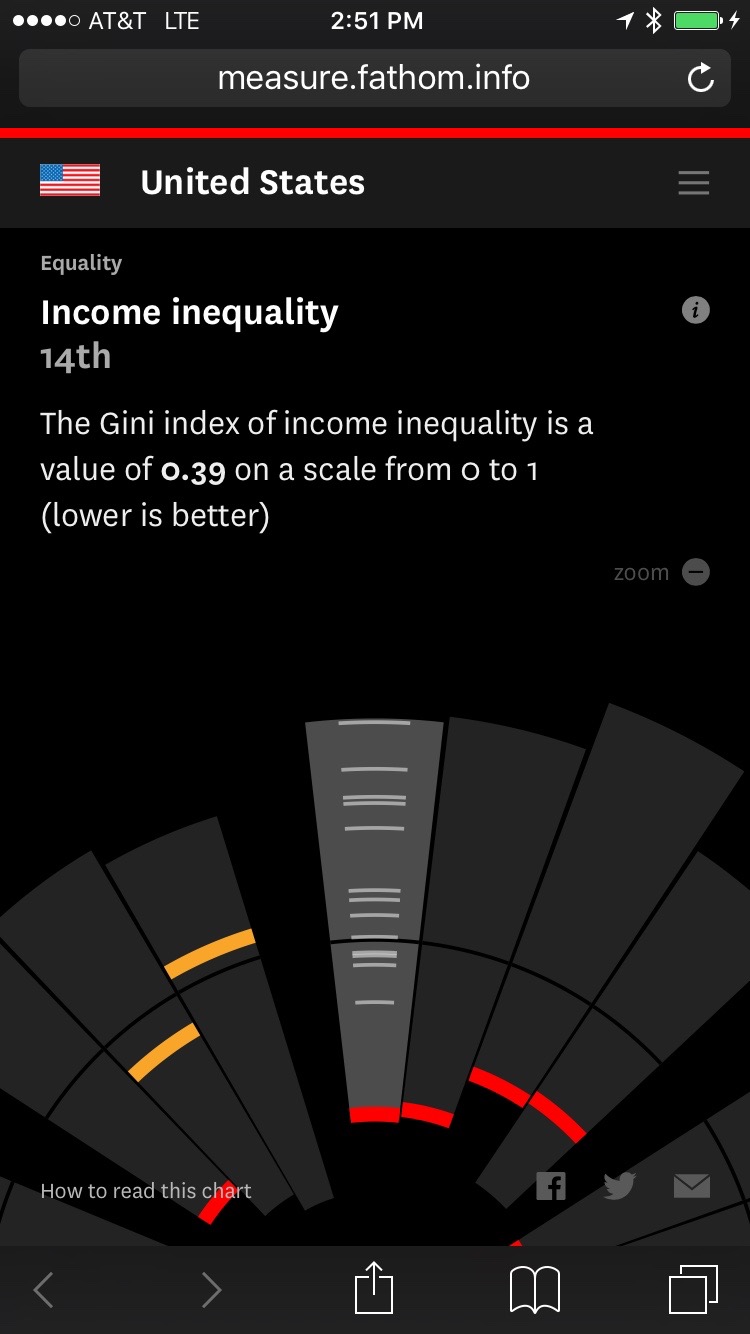
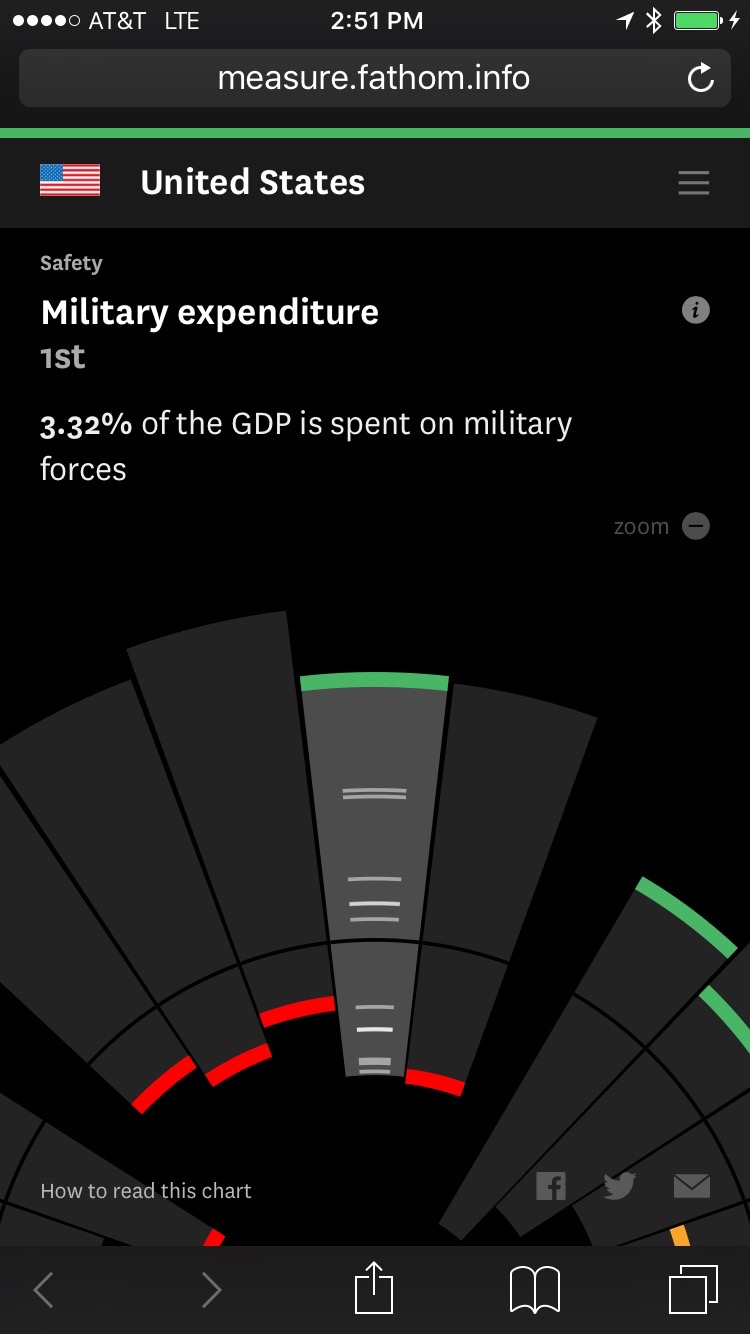
We have the highest homicide rates, highest incarceration rates, lowest voter turnout, and greatest income inequality. We lead in only a few areas, including military and healthcare spending (though we have the worst return on investment when healthcare spending is compared to life expectancy).
To learn more, view the piece and interact with the data yourself.
The data is interesting because it challenges some widely-held assumptions about America’s status as a global leader. “If America were a corporation, it would today be the equivalent of IBM in the 1990s–an industry giant that’s failing to keep up with the times,” Friedman writes.
That’s an angle he takes throughout the book—examining countries as if he were an auditor examining massive corporations, looking for areas of improvement rather than making arbitrary judgement calls.
While it might be tempting to take each country's average ranking across all indicators and compare them on a grand scale, that isn't really the point. Since these countries have different cultures, economies, and other factors, it’s hard to make a worthwhile across-the-board comparison. Plus, the indicators aren’t equally weighted. Some, like life expectancy, are probably more important than others, but it would be hard to agree on the correct weighting for each indicator.
But even if we can’t make an overall ranking, it is important to see where other countries are succeeding and try to learn from their success. As Friedman puts it, “companies that are willing to learn will grow and prosper while the manufacturers of black-and-white televisions and eight-track tapes become resigned to the pages of history books.”
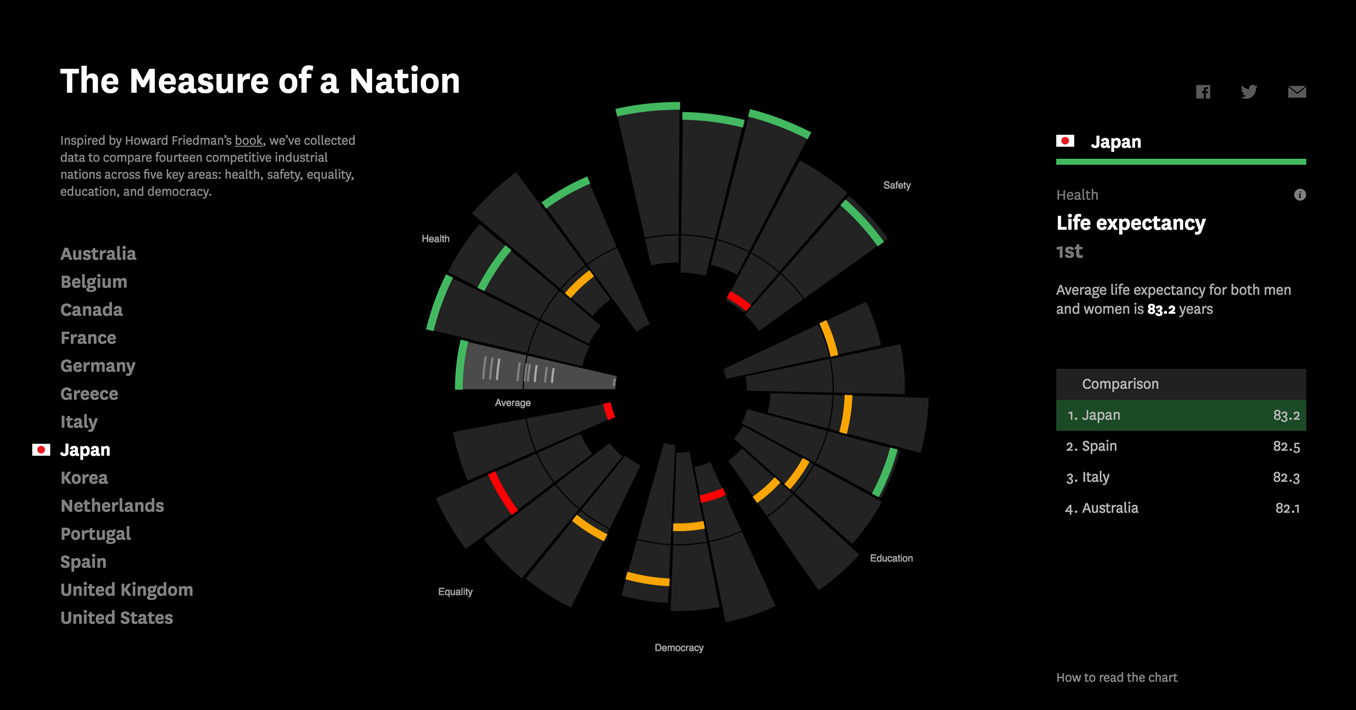
Using the 14 countries from Friedman’s book, we collected data on 23 indicators of national well-being in Friedman’s five categories: health, safety, education, equality, and democracy.
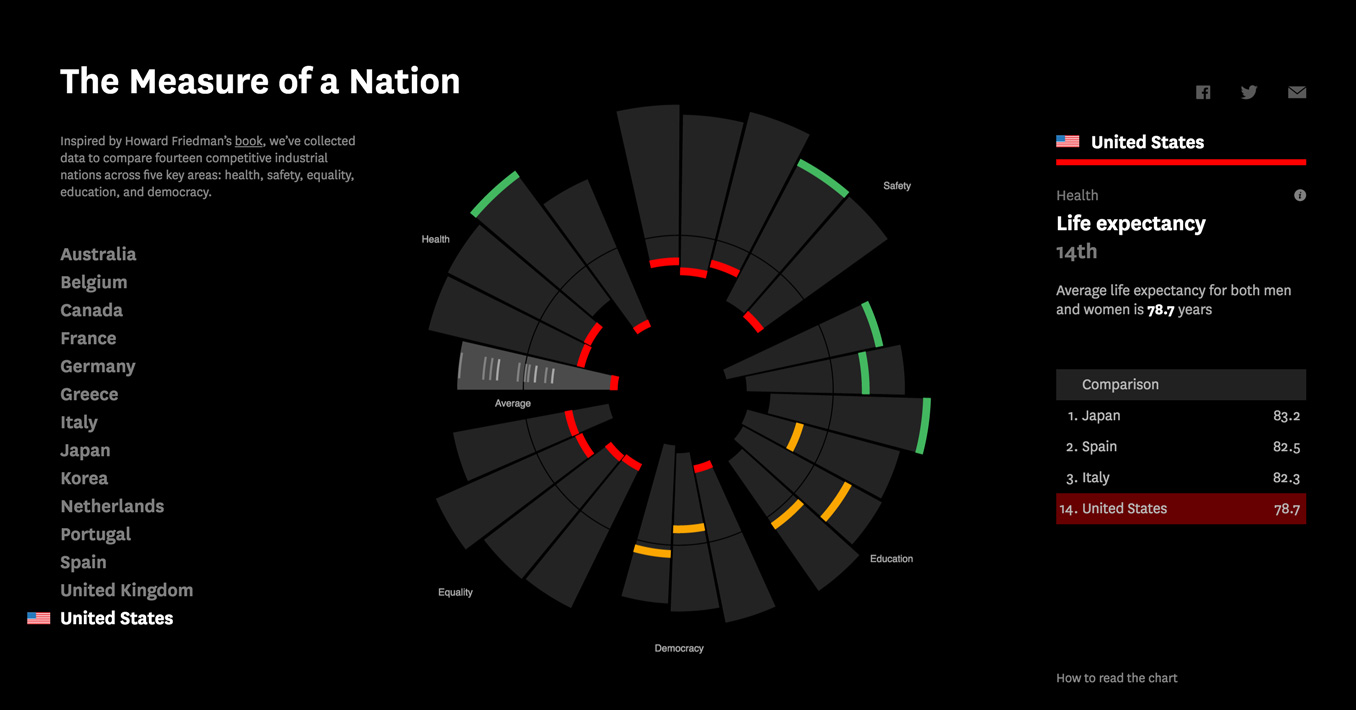
In order to make fair comparisons with the United States (which is difficult given our size and a host of other factors), Friedman selected countries that were relatively wealthy, with per-capita GDPs greater than $20,000, and relatively large, with populations at least the size of New York City. That eliminates small city-states like Luxembourg.
This chart makes it easy to get a quick idea of how a country is doing, and because the indicators are arranged by category, you can see exactly where a country is succeeding or struggling. Japan, for example, does well in health in safety, but not as well in equality and democracy.
The imperfections of rankings
This whole visualization is built around the idea of ranking countries. Nearly everything in the design, from the position of countries to the colors, is determined by rank.
But the truth is, it’s not always a good idea to rank things, and depending on the data, a ranking can give a faulty impression. For an example, let’s look at the “income mobility” indicator, which come from a 2009 paper by London School of Economics researcher Jo Blanden.
In the paper, Blanden uses a complicated formula to calculate an “elasticity index” representing income mobility between generations. But since these figures are estimates, they come with standard errors, which in some cases are quite large.
Blanden gives the U.S. an elasticity index of 0.41 and the U.K. an index of 0.37 (lower is better). But the U.S. has a standard error of 0.09 and the U.K. has a standard error of 0.05, meaning it’s possible that the U.S.’s actual index is as low as 0.32 and the U.K.’s is as high as 0.42. That totally reverses the rank.
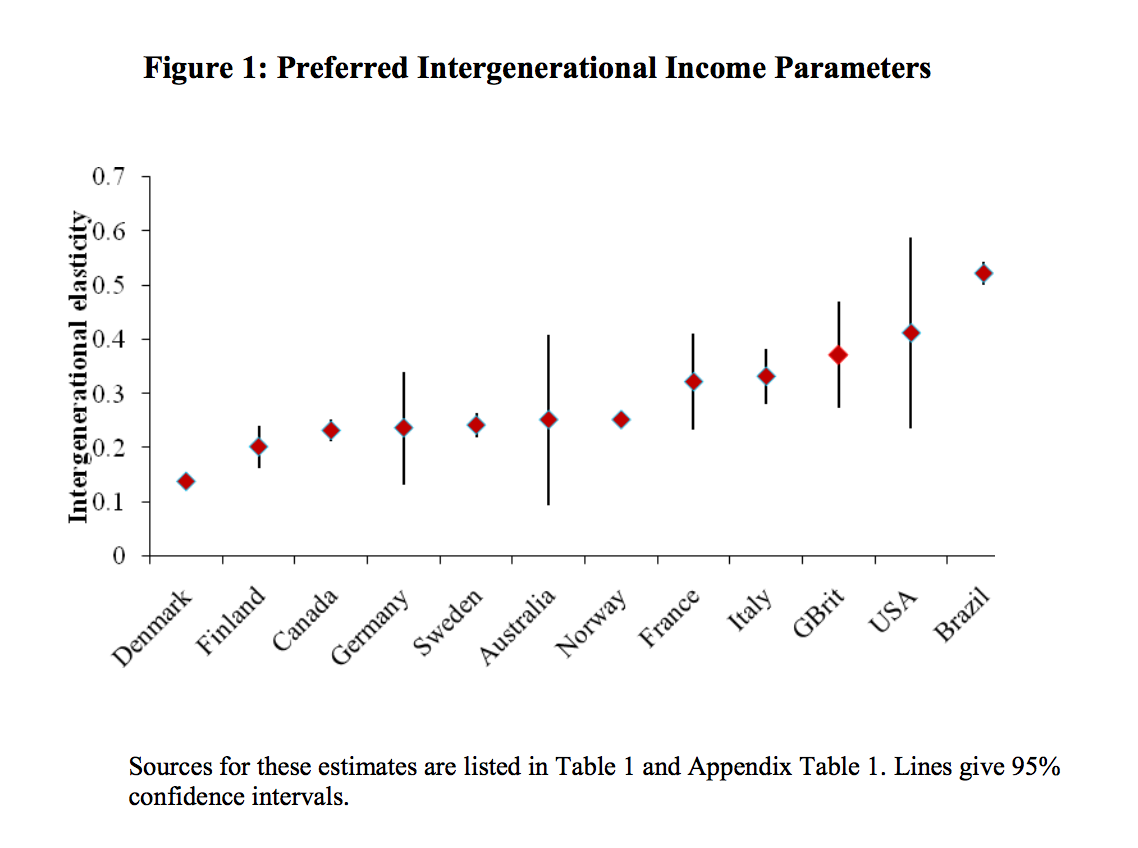
In fact, Blanden notes this and explicitly warns against using this measure to rank countries. “While it is tempting to immediately form the estimates into a ‘league table,’ we must pay attention to the size of the standard errors,” she writes. “Large standard errors on the Australian, French, British and U.S. estimates [make] it unclear how these countries should be ranked.”
Since this visualization is just an introductory piece for public use, we were less concerned about the detail lost by using rankings (plus they're used in the book, so we didn’t want to leave them out). But if we were to revisit the piece for an audience of policy-makers, for instance, we'd be using a very different representation that would de-emphasize rankings and do more to expose details like standard error to avoid any erroneous conclusions.
To learn more, view the piece and interact with the data yourself.
We’d love to hear what you’re working on, what you’re curious about, and what messy data problems we can help you solve. Drop us a line at hello@fathom.info, or you can subscribe to our newsletter for updates.