Technical development has brought physical tracking of sports events to a high degree of reliability, enabling real-time data collection and processing for statistical and analytical purposes, in addition to enhancing the spectators’ experience of the event through integration with the broadcasting system. There are currently many examples in football, soccer and even NASCAR racing.
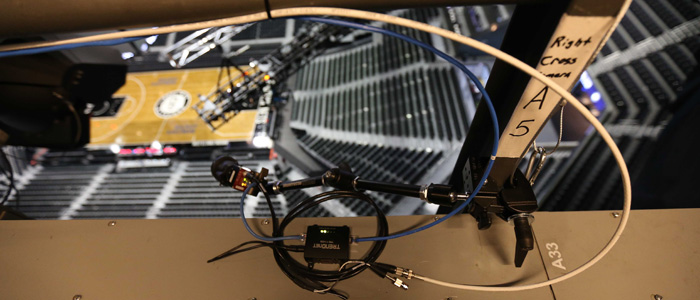
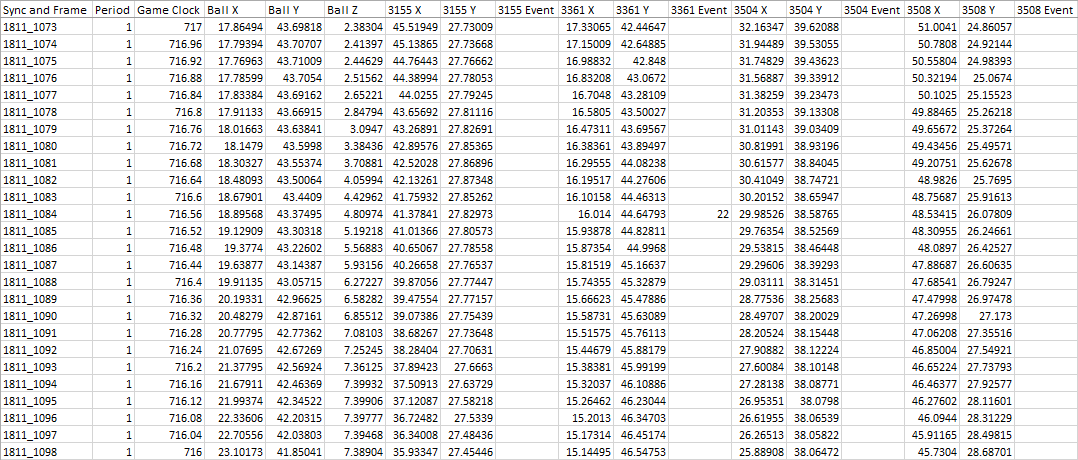
Since 2010, the NBA has embraced these technologies, and recently announced a major agreement to implement live player tracking for all 30 teams in the league. The idea is actually rather simple: by populating the venue with sets of cameras and running computer-vision algorithms on the footage, the system is able to produce sets of X, Y, Z positions for each player and the ball for every frame, in this case 25 times per second. The system then couples that positioning with actual game event markings.
What? Our favorite sport coupled with lots of data? We had to give this a try!
Back in 2011 we got our hands on one of these sets of data, thanks to Brian Kopp, for the Oklahoma City Thunder vs. San Antonio Spurs game of February 23, 2011. Using Processing, we built a sketch to parse through the game’s data, and help us dynamically navigate through the gameplay and statistics.
Beyond letting us ‘watch’ the game over and over, the tool gave us the opportunity to delve a bit deeper into players’ behaviors and patterns. We were particularly interested in figuring out how each player’s intervention affected the game, whether positively or negatively.
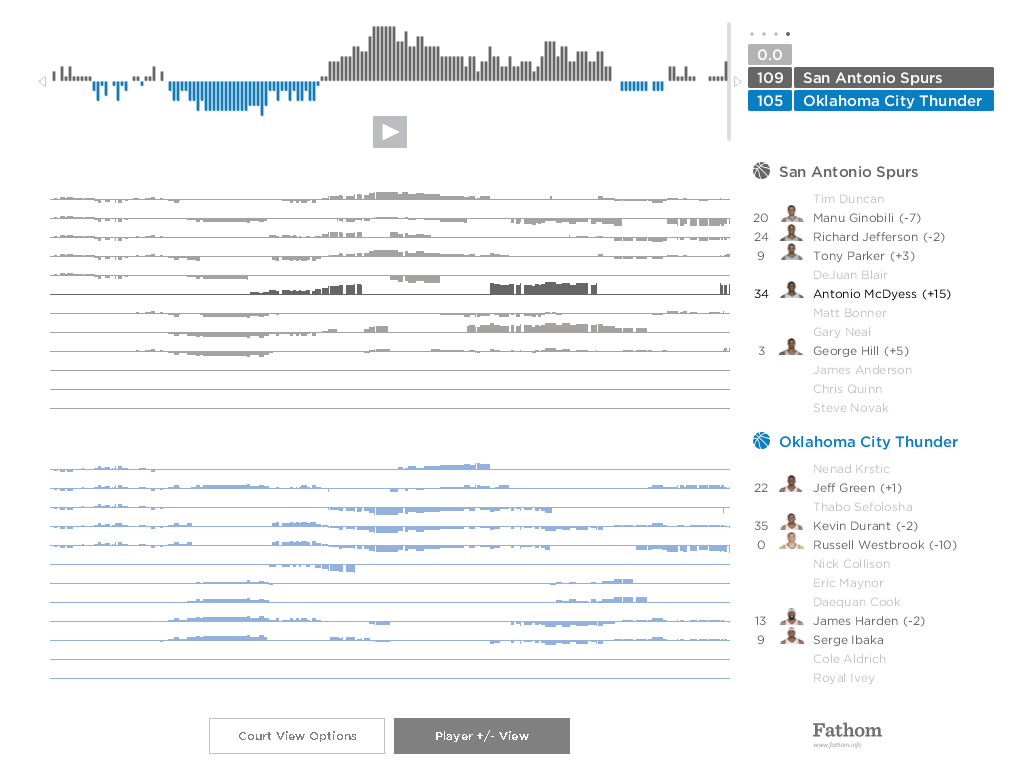
In the game Antonio McDyess was not a starter, scored only six points, and wasn’t even mentioned in the game’s recap. But as it turns out, his presence on the court was crucial for San Antonio’s big score turnaround, and his leave at 8:50 of the second period was closely followed by Oklahoma’s momentary comeback. Whether these events are related or not, we’ll leave to your own judgment.
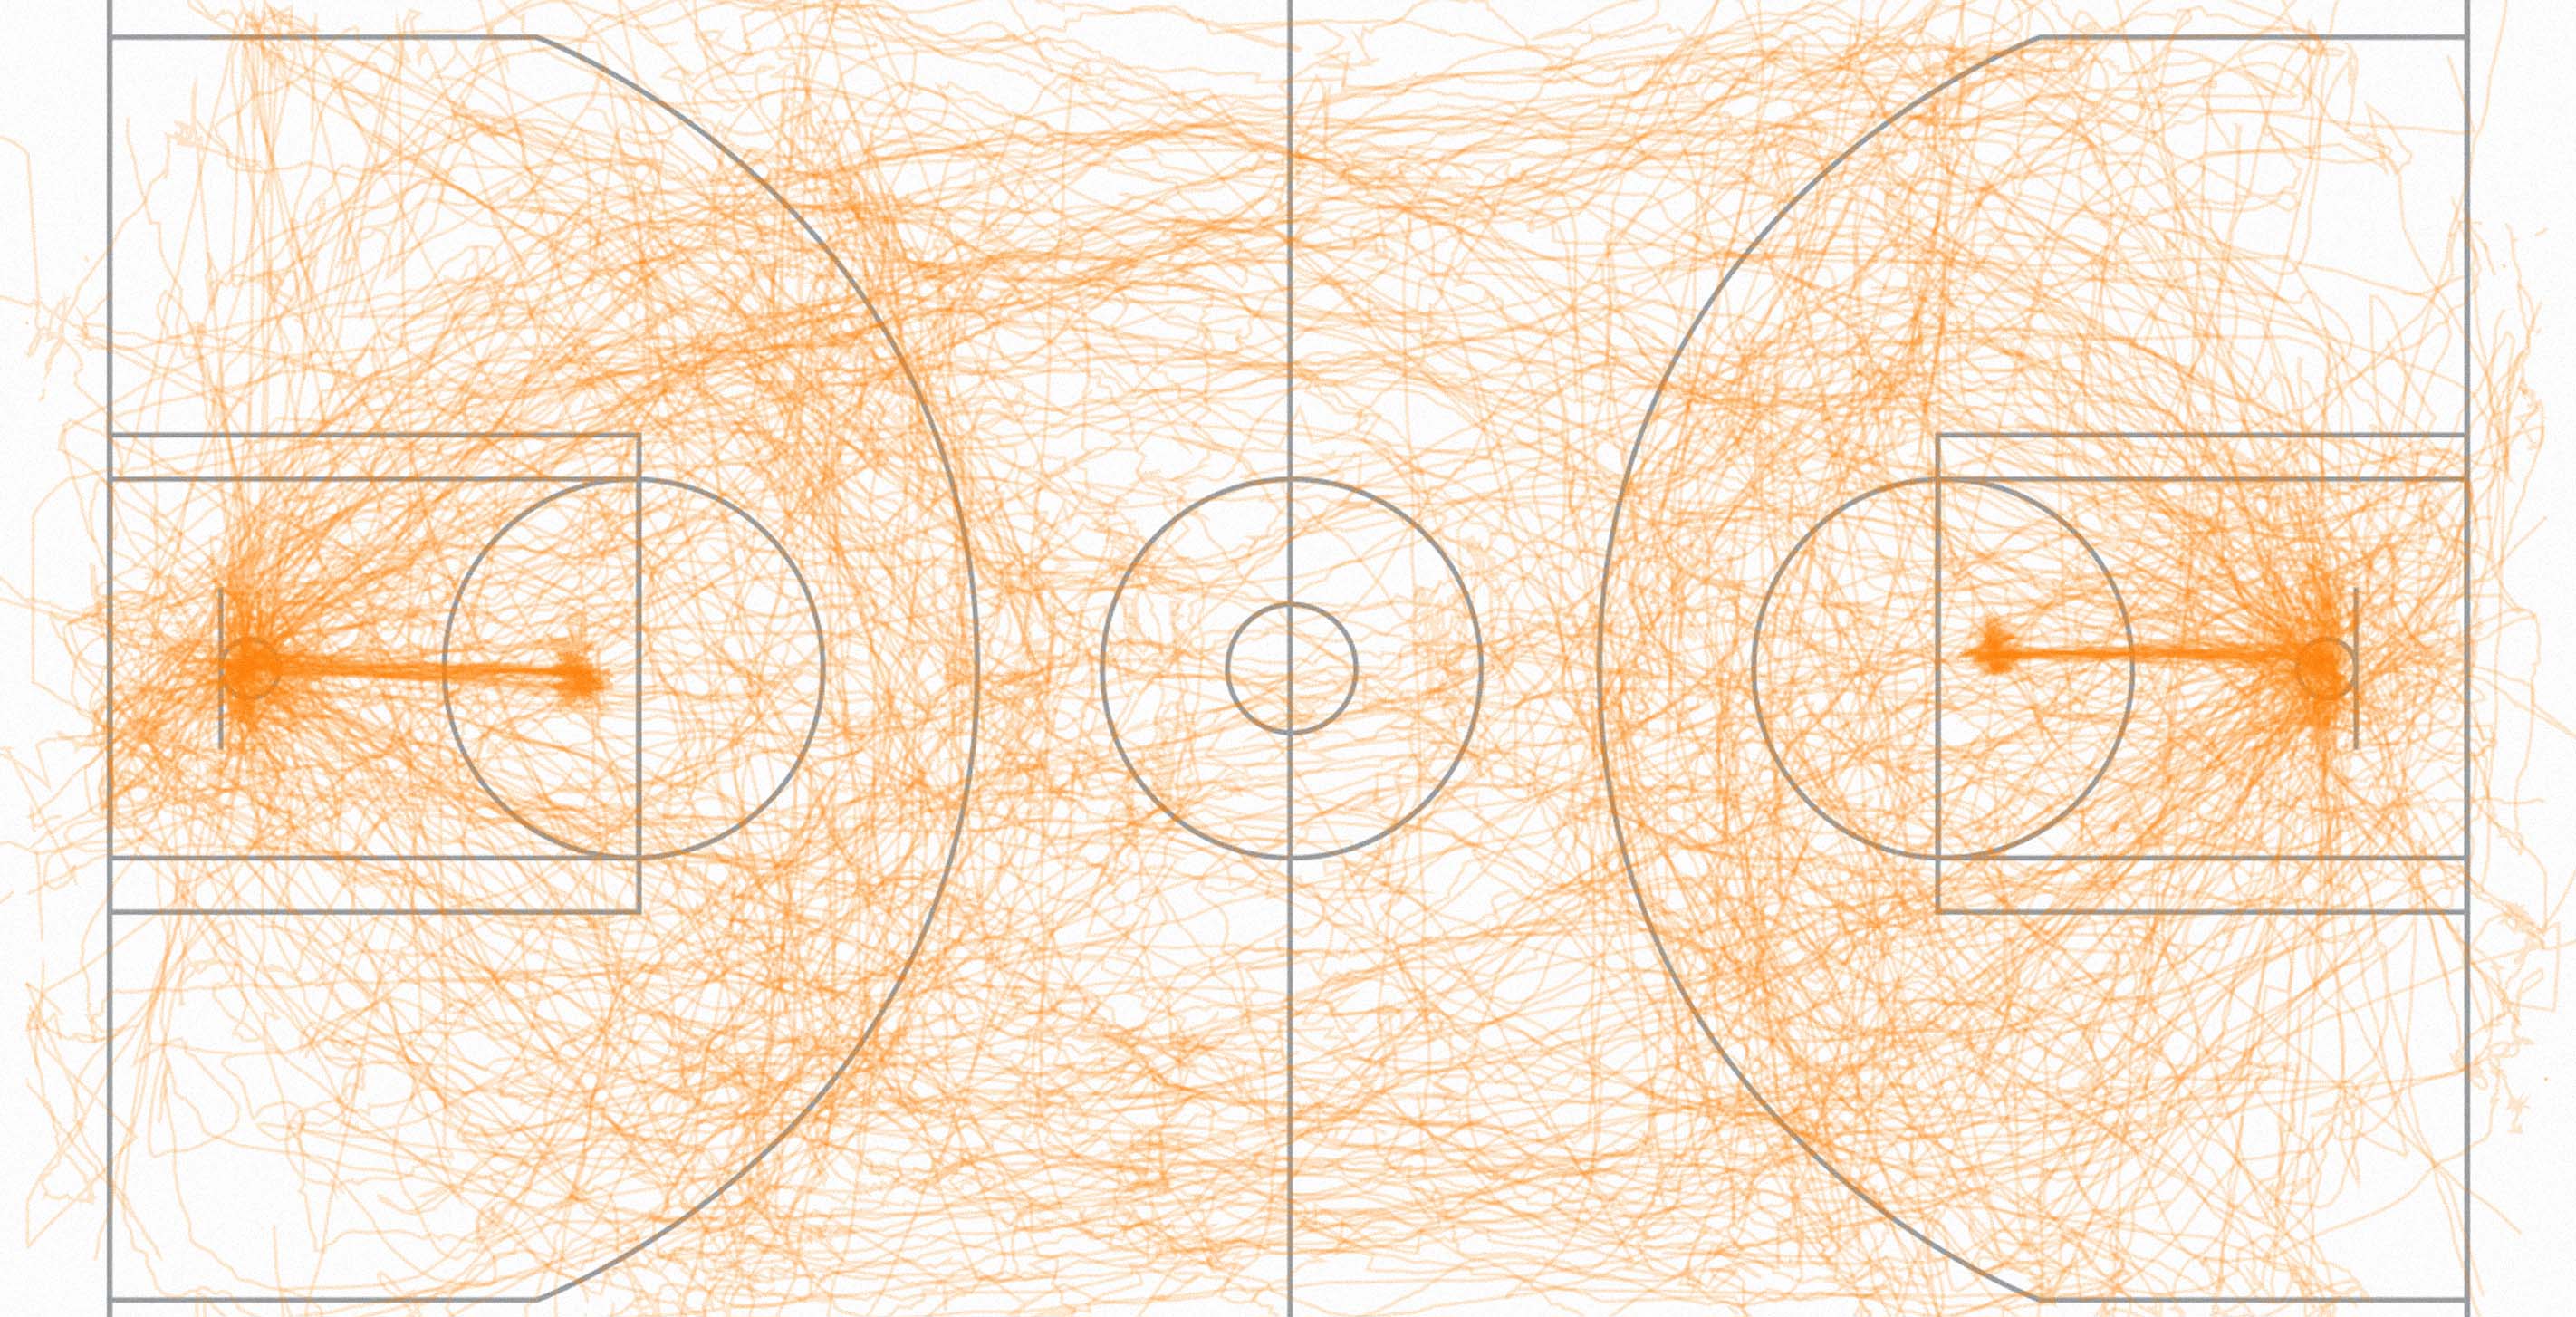
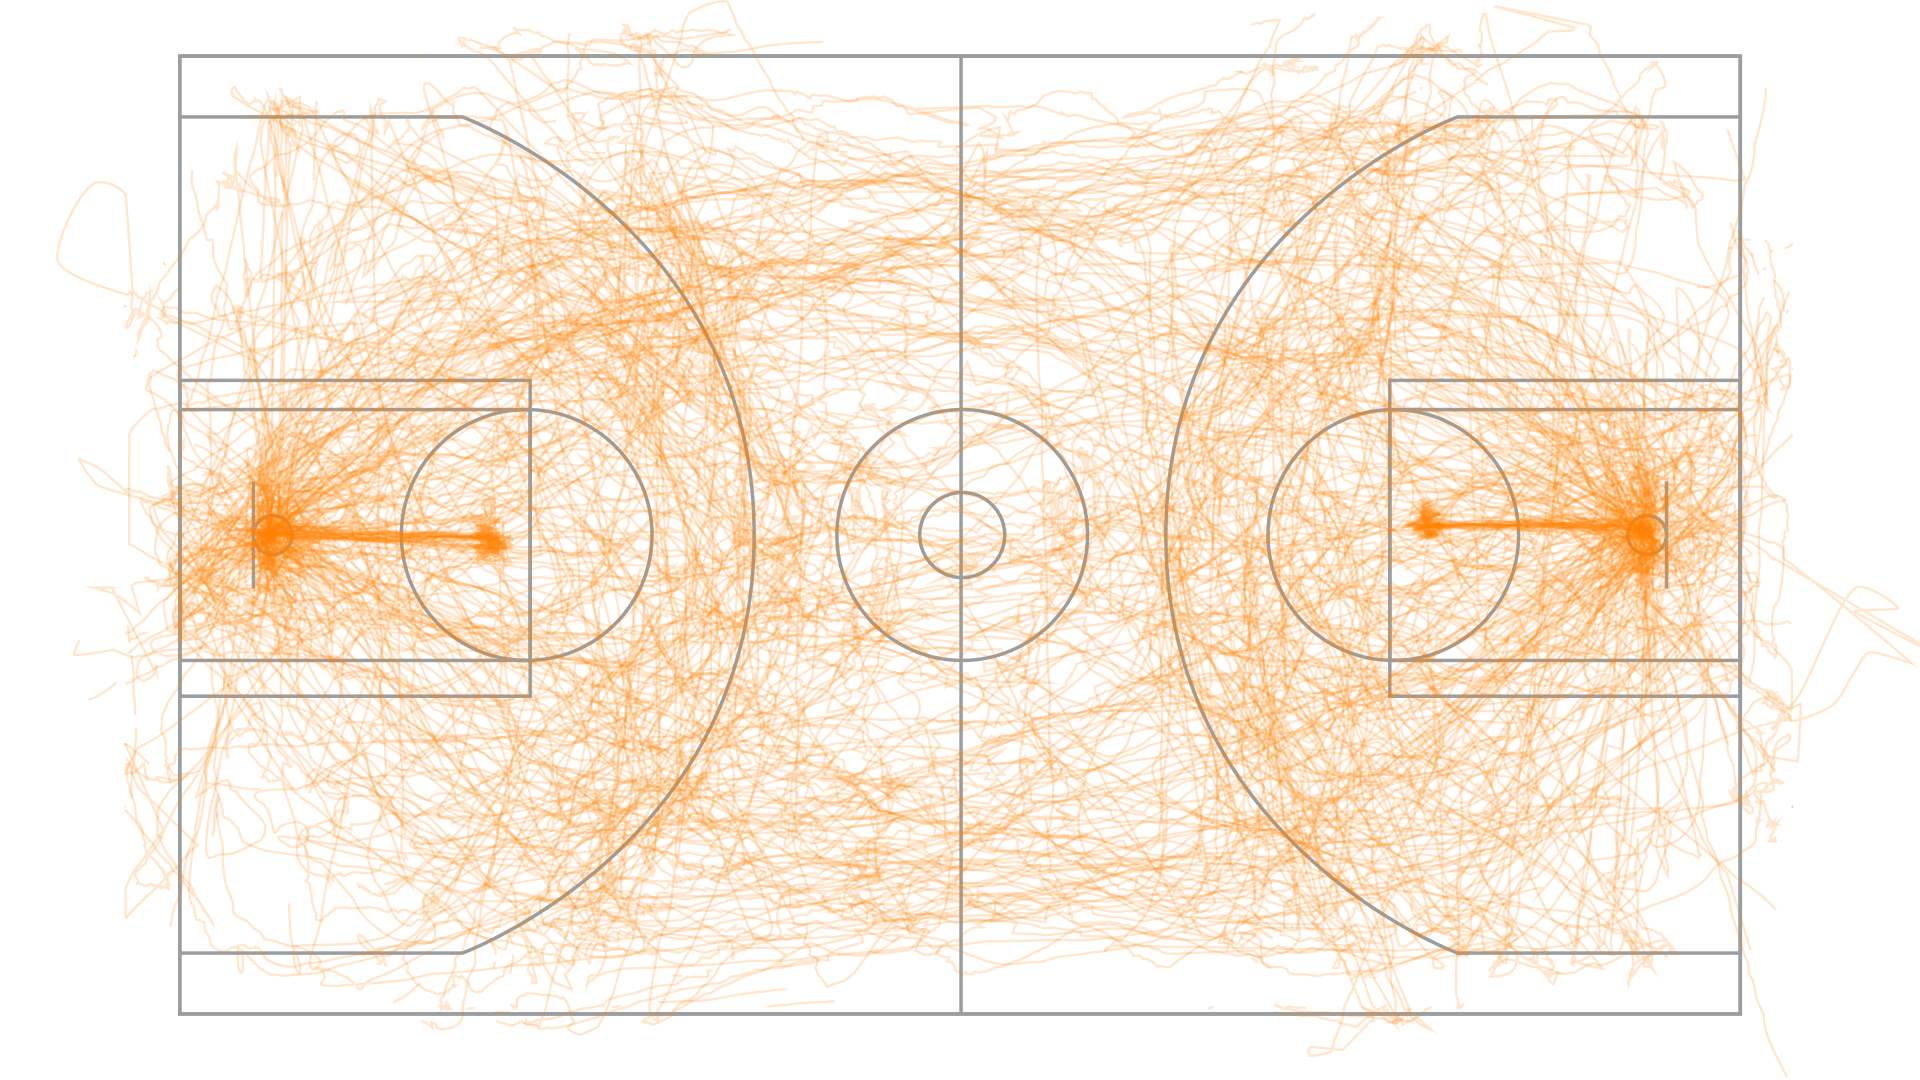
Furthermore, we wanted to explore game behavior related to the vast collection of location data collected for this game. Accumulating the ball movement throughout the complete game revealed interesting patterns, such as movement concentration around the 3-point mark, preferred shooting spots, or that players tend to transition into offense along the sides of the court.
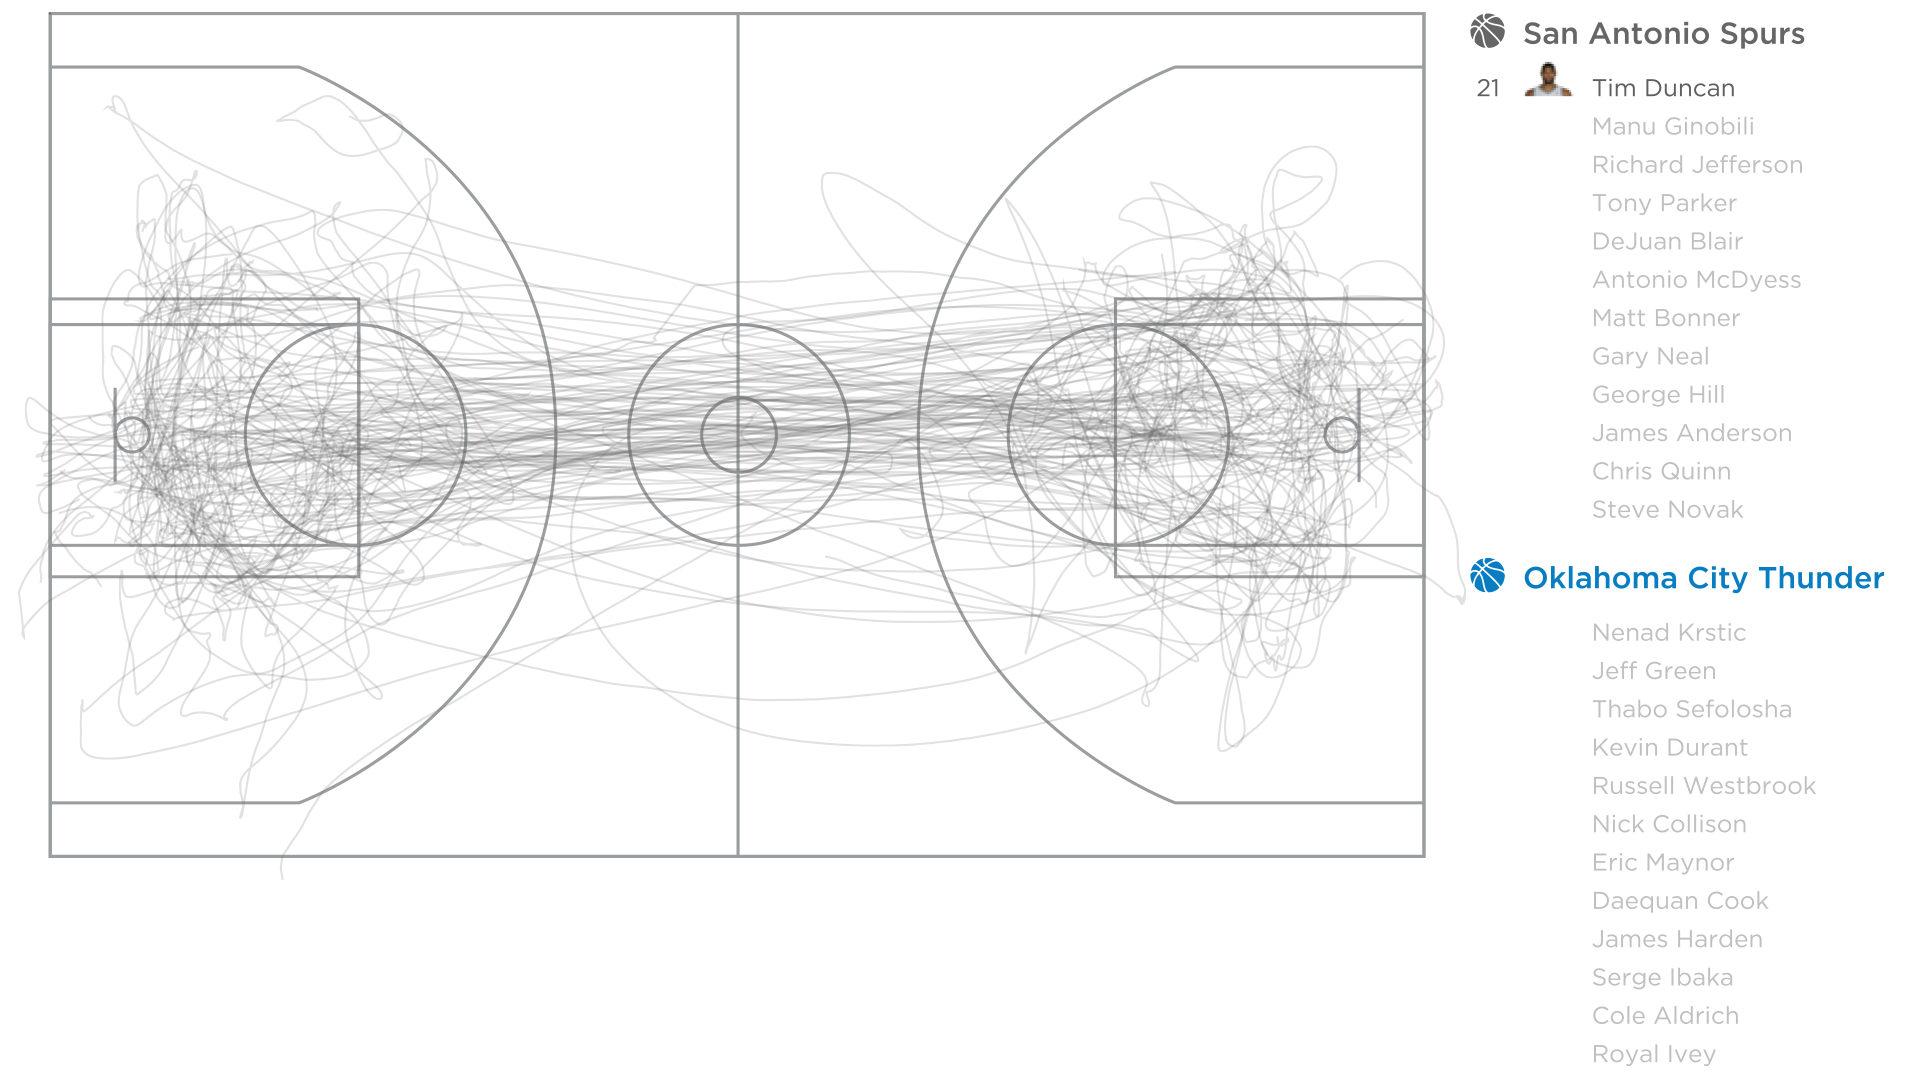
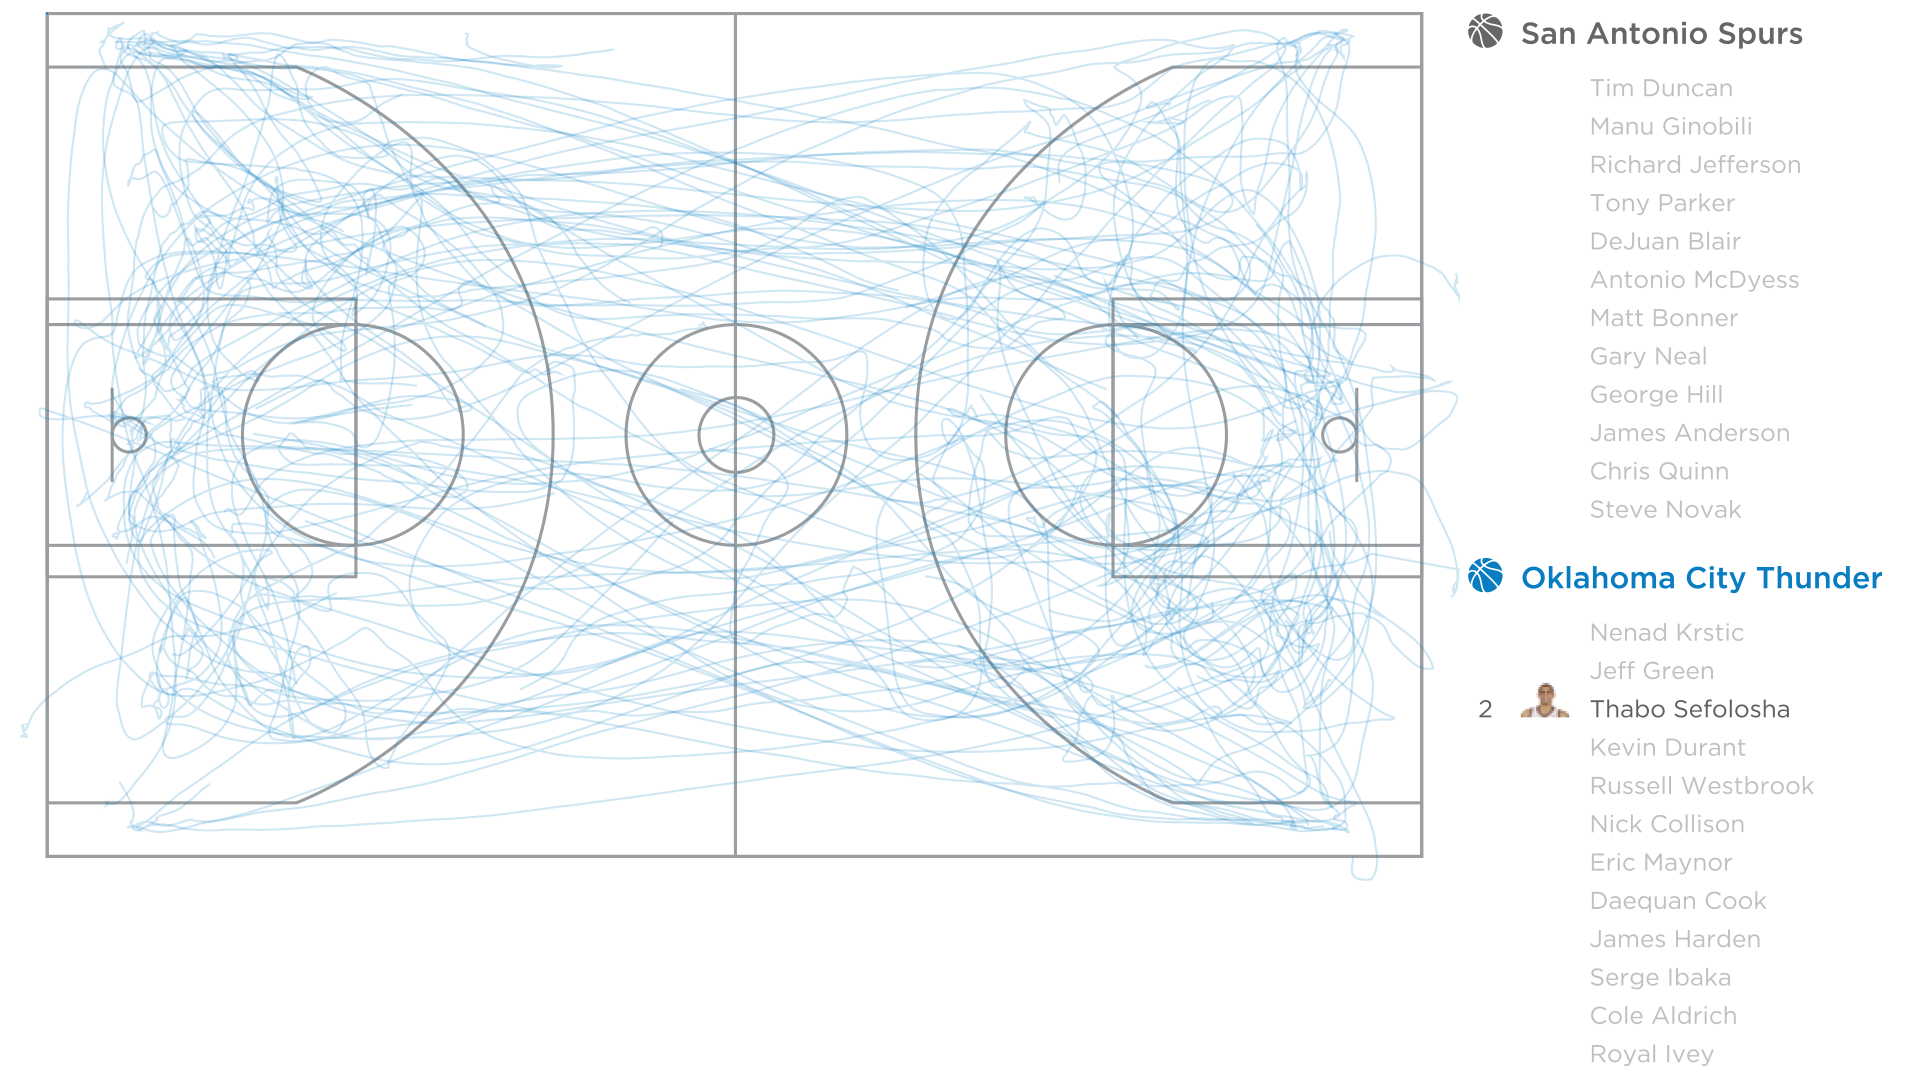
Recursively stacking players’ movement over the game also shows some relevant patterns emerging, exposing each player’s recurrent locations, standings, and alignments according to their team position.
Stay tuned for next iterations in the third dimension. Until then, here's a very interesting article on the subject matter.
We’d love to hear what you’re working on, what you’re curious about, and what messy data problems we can help you solve. Drop us a line at hello@fathom.info, or you can subscribe to our newsletter for updates.