The Sabeti Lab | Sentinel
Banyan
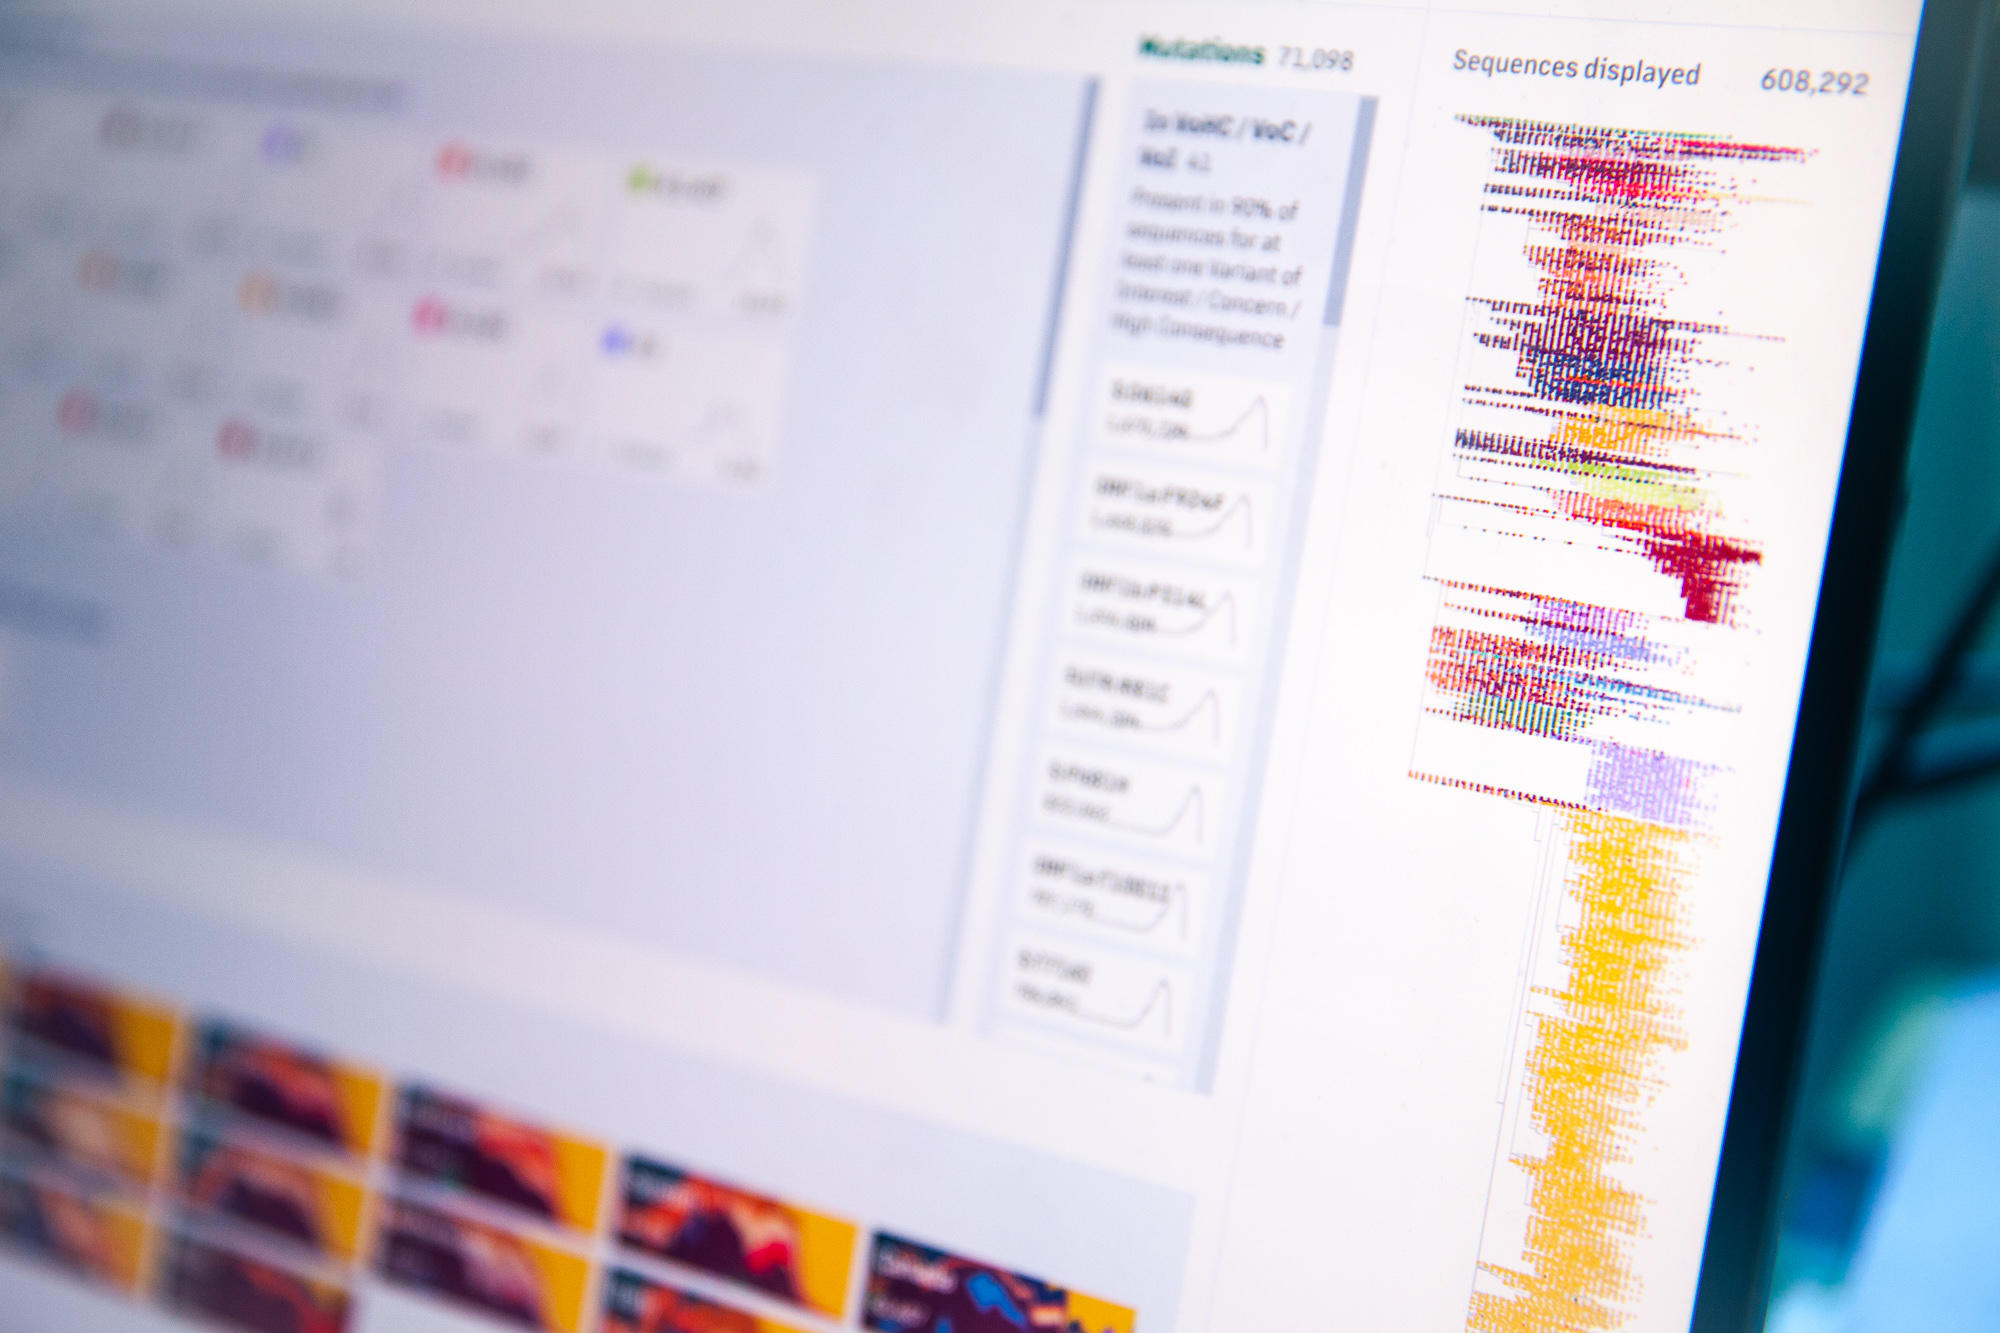
With the support of the Sabeti Lab, we have built a tool to visualize the full global dataset of COVID-19 sequences. With over two million sequences available and a phylogentic tree of over 600,000, we have created an exceptionally fluid interface for exploring vast amounts of viral genomic data.
Capabilities
- Large-scale data visualization optimization for the web
- Front-end design and development
- Rapid prototyping
- Building expert level tools for scientists
Challenges
- How can we enable virology researchers to explore
the entire global COVID-19 sequencing dataset? - How can we bring visualization upstream in the reasearch pipeline?
Achievements
- Created a tool that visualizes over a million COVID-19 samples without the need for a server backend.
- Surpassed the typical cap of ~4,000 sequences of most other genomic research tools
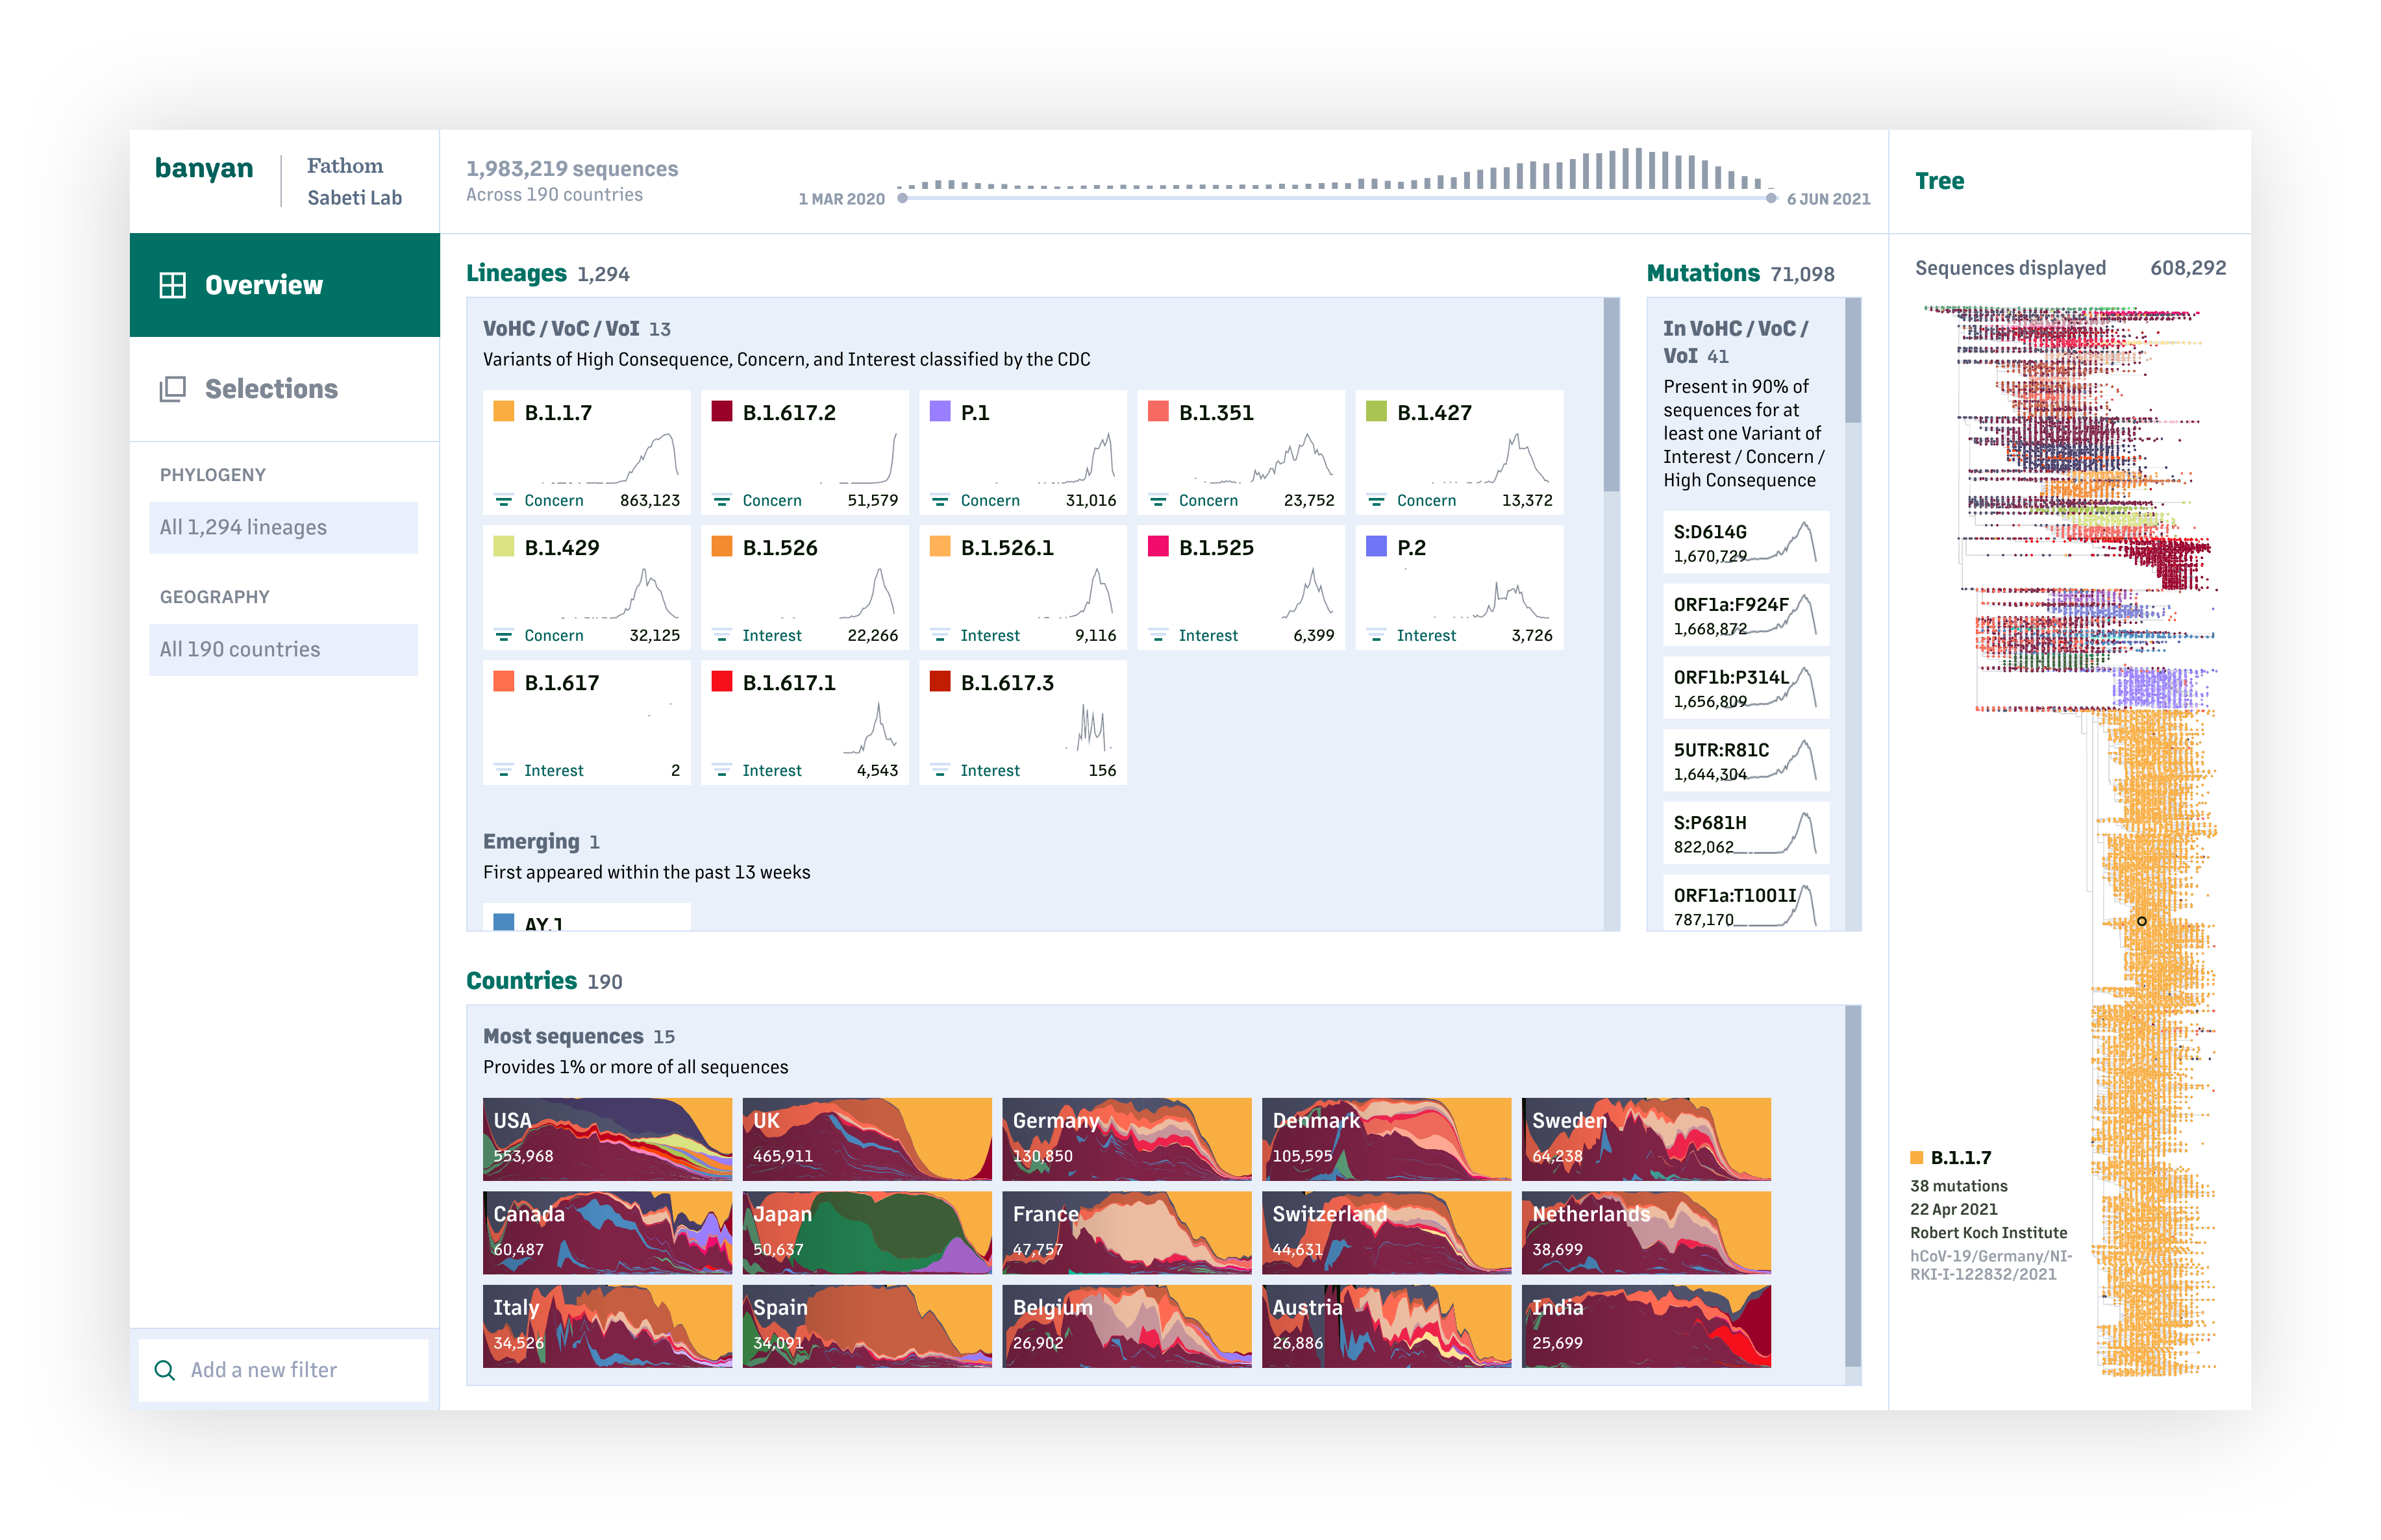
Through rapid rounds of iteration and feedback from researchers at the Sabeti Lab, as well as outside input from leading researchers in the field, we were able to create a tool that addresses many of the questions scientists are asking of the COVID-19 viral data – Which lineages are taking hold? Where are they becoming a problem? What does COVID-19 look like in my jurisdiction compared to my surrounding areas?
One of our key goals when building tools is to bring visualization further upstream in the research process. For example, how can it be part of the way researchers explore and understand their data—and make better use of data that is continually changing and being updated—instead of just "final" outputs for a report or presentation?
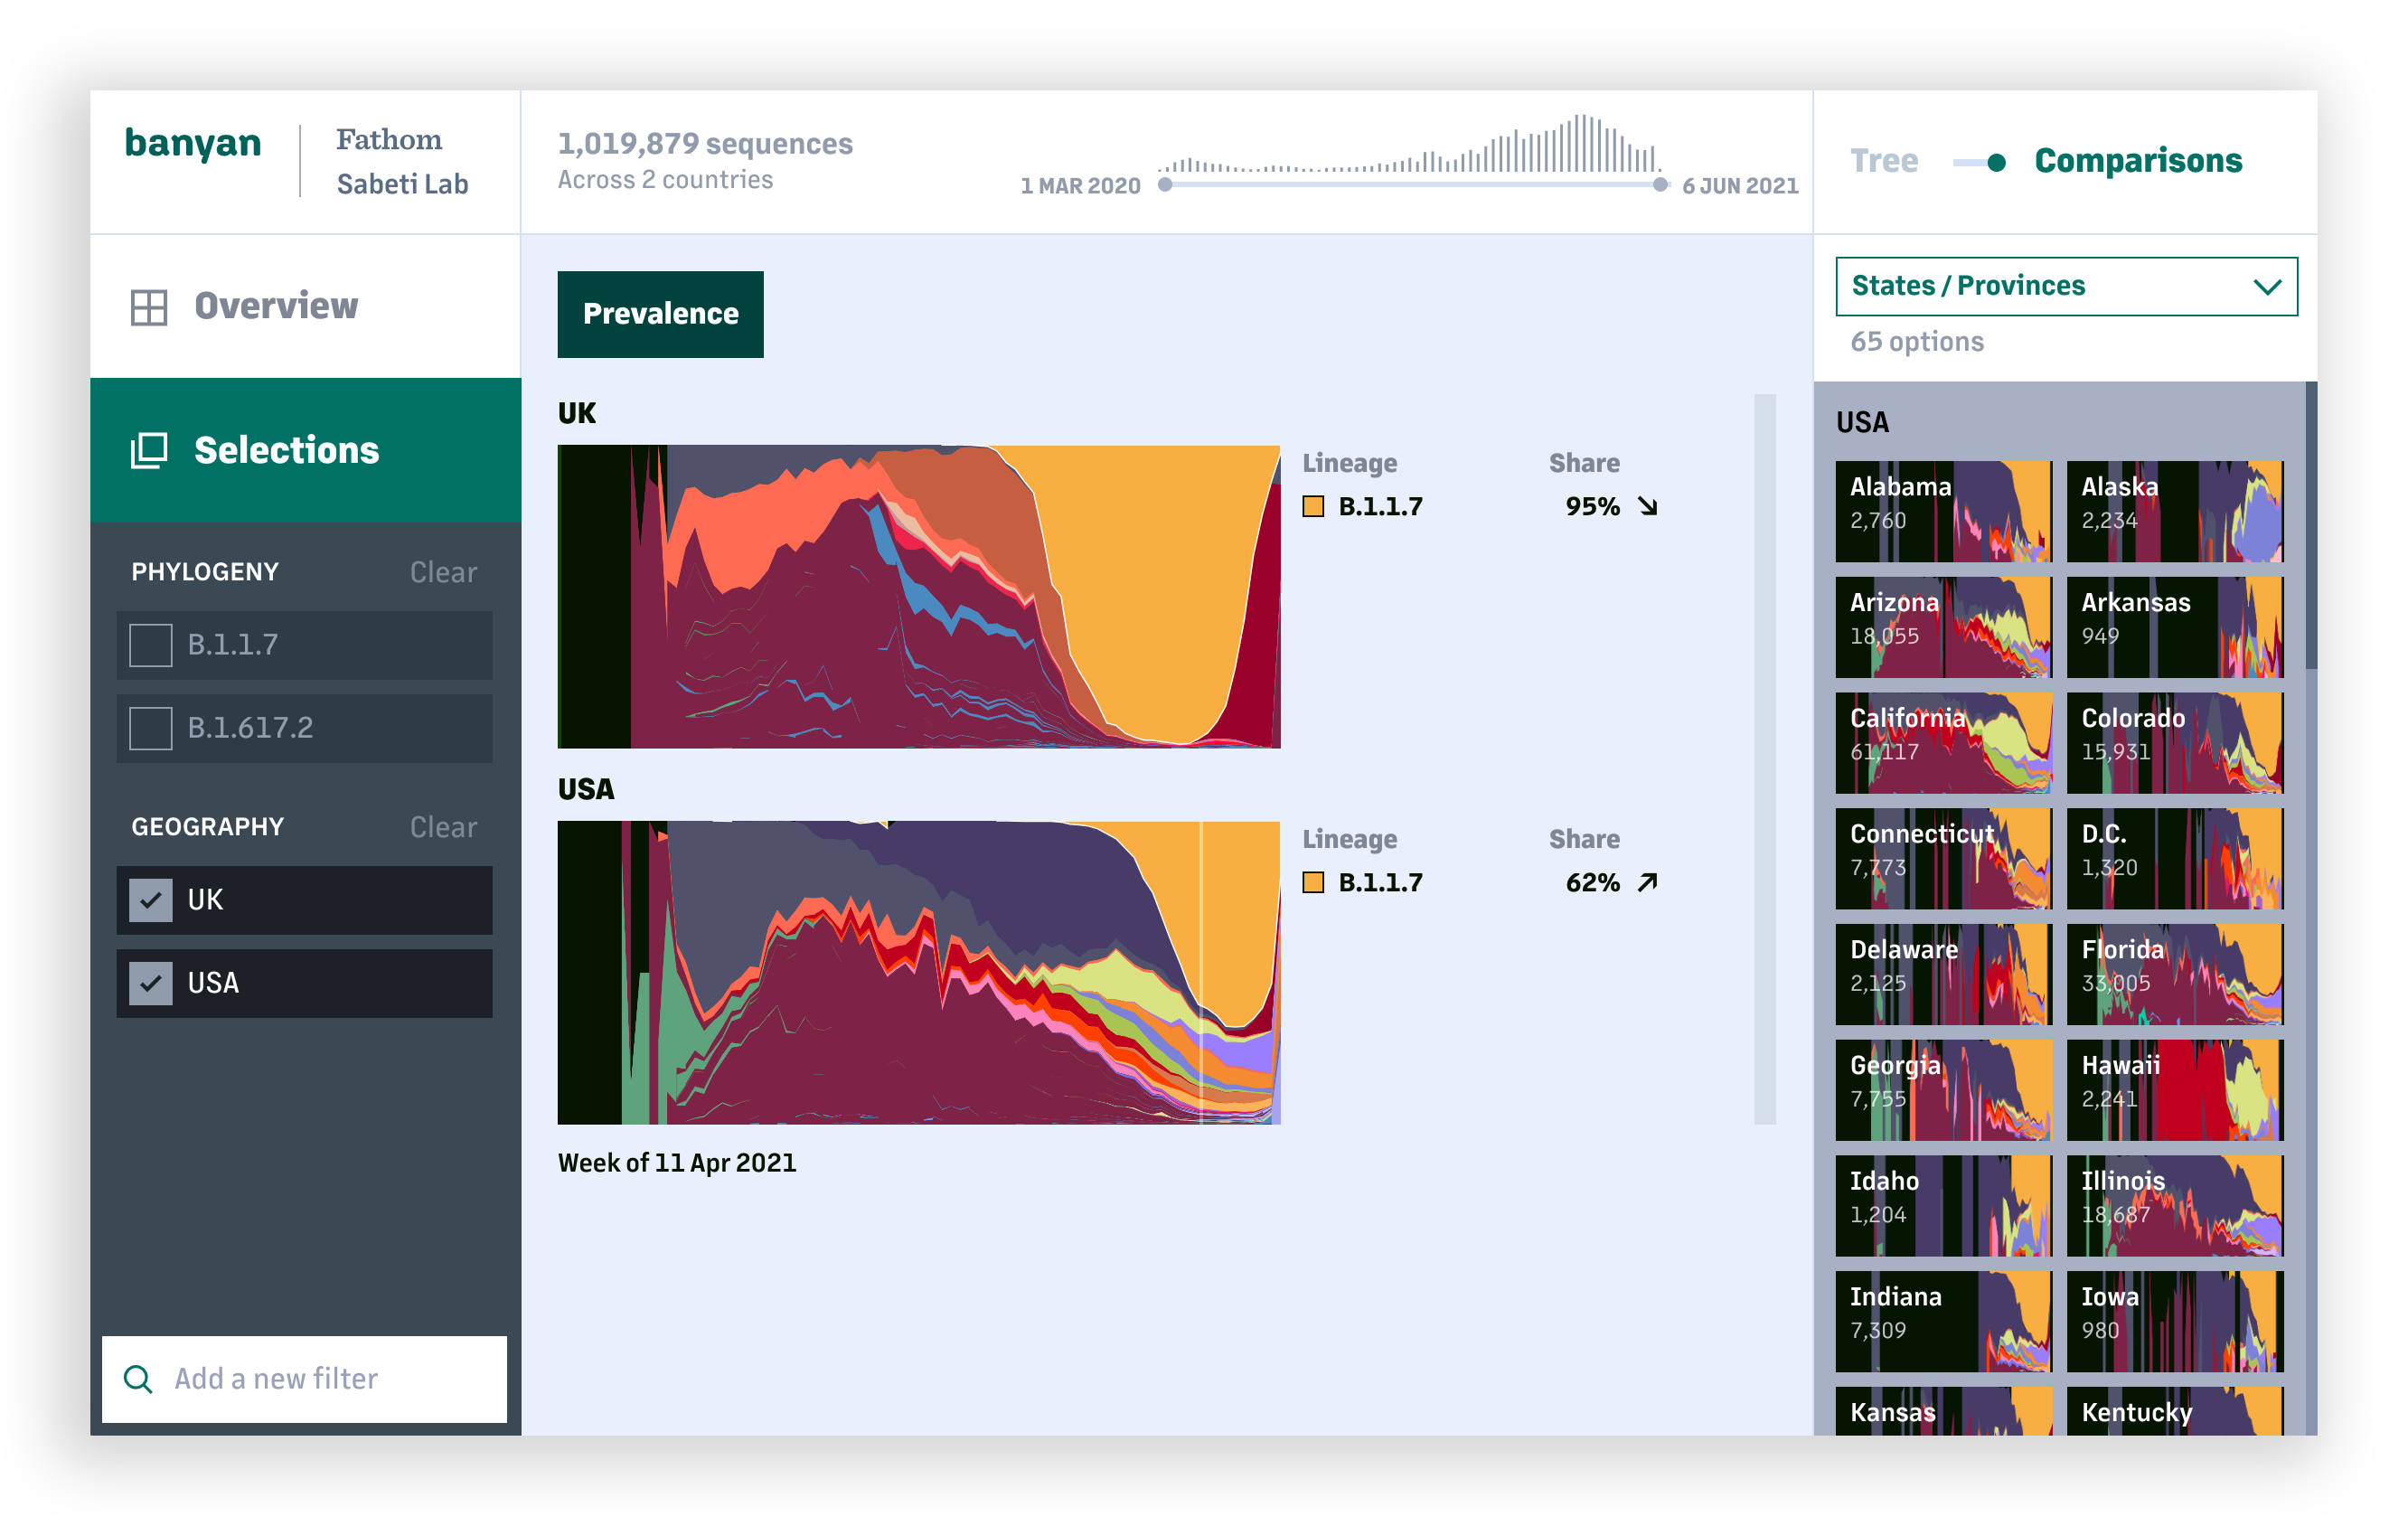
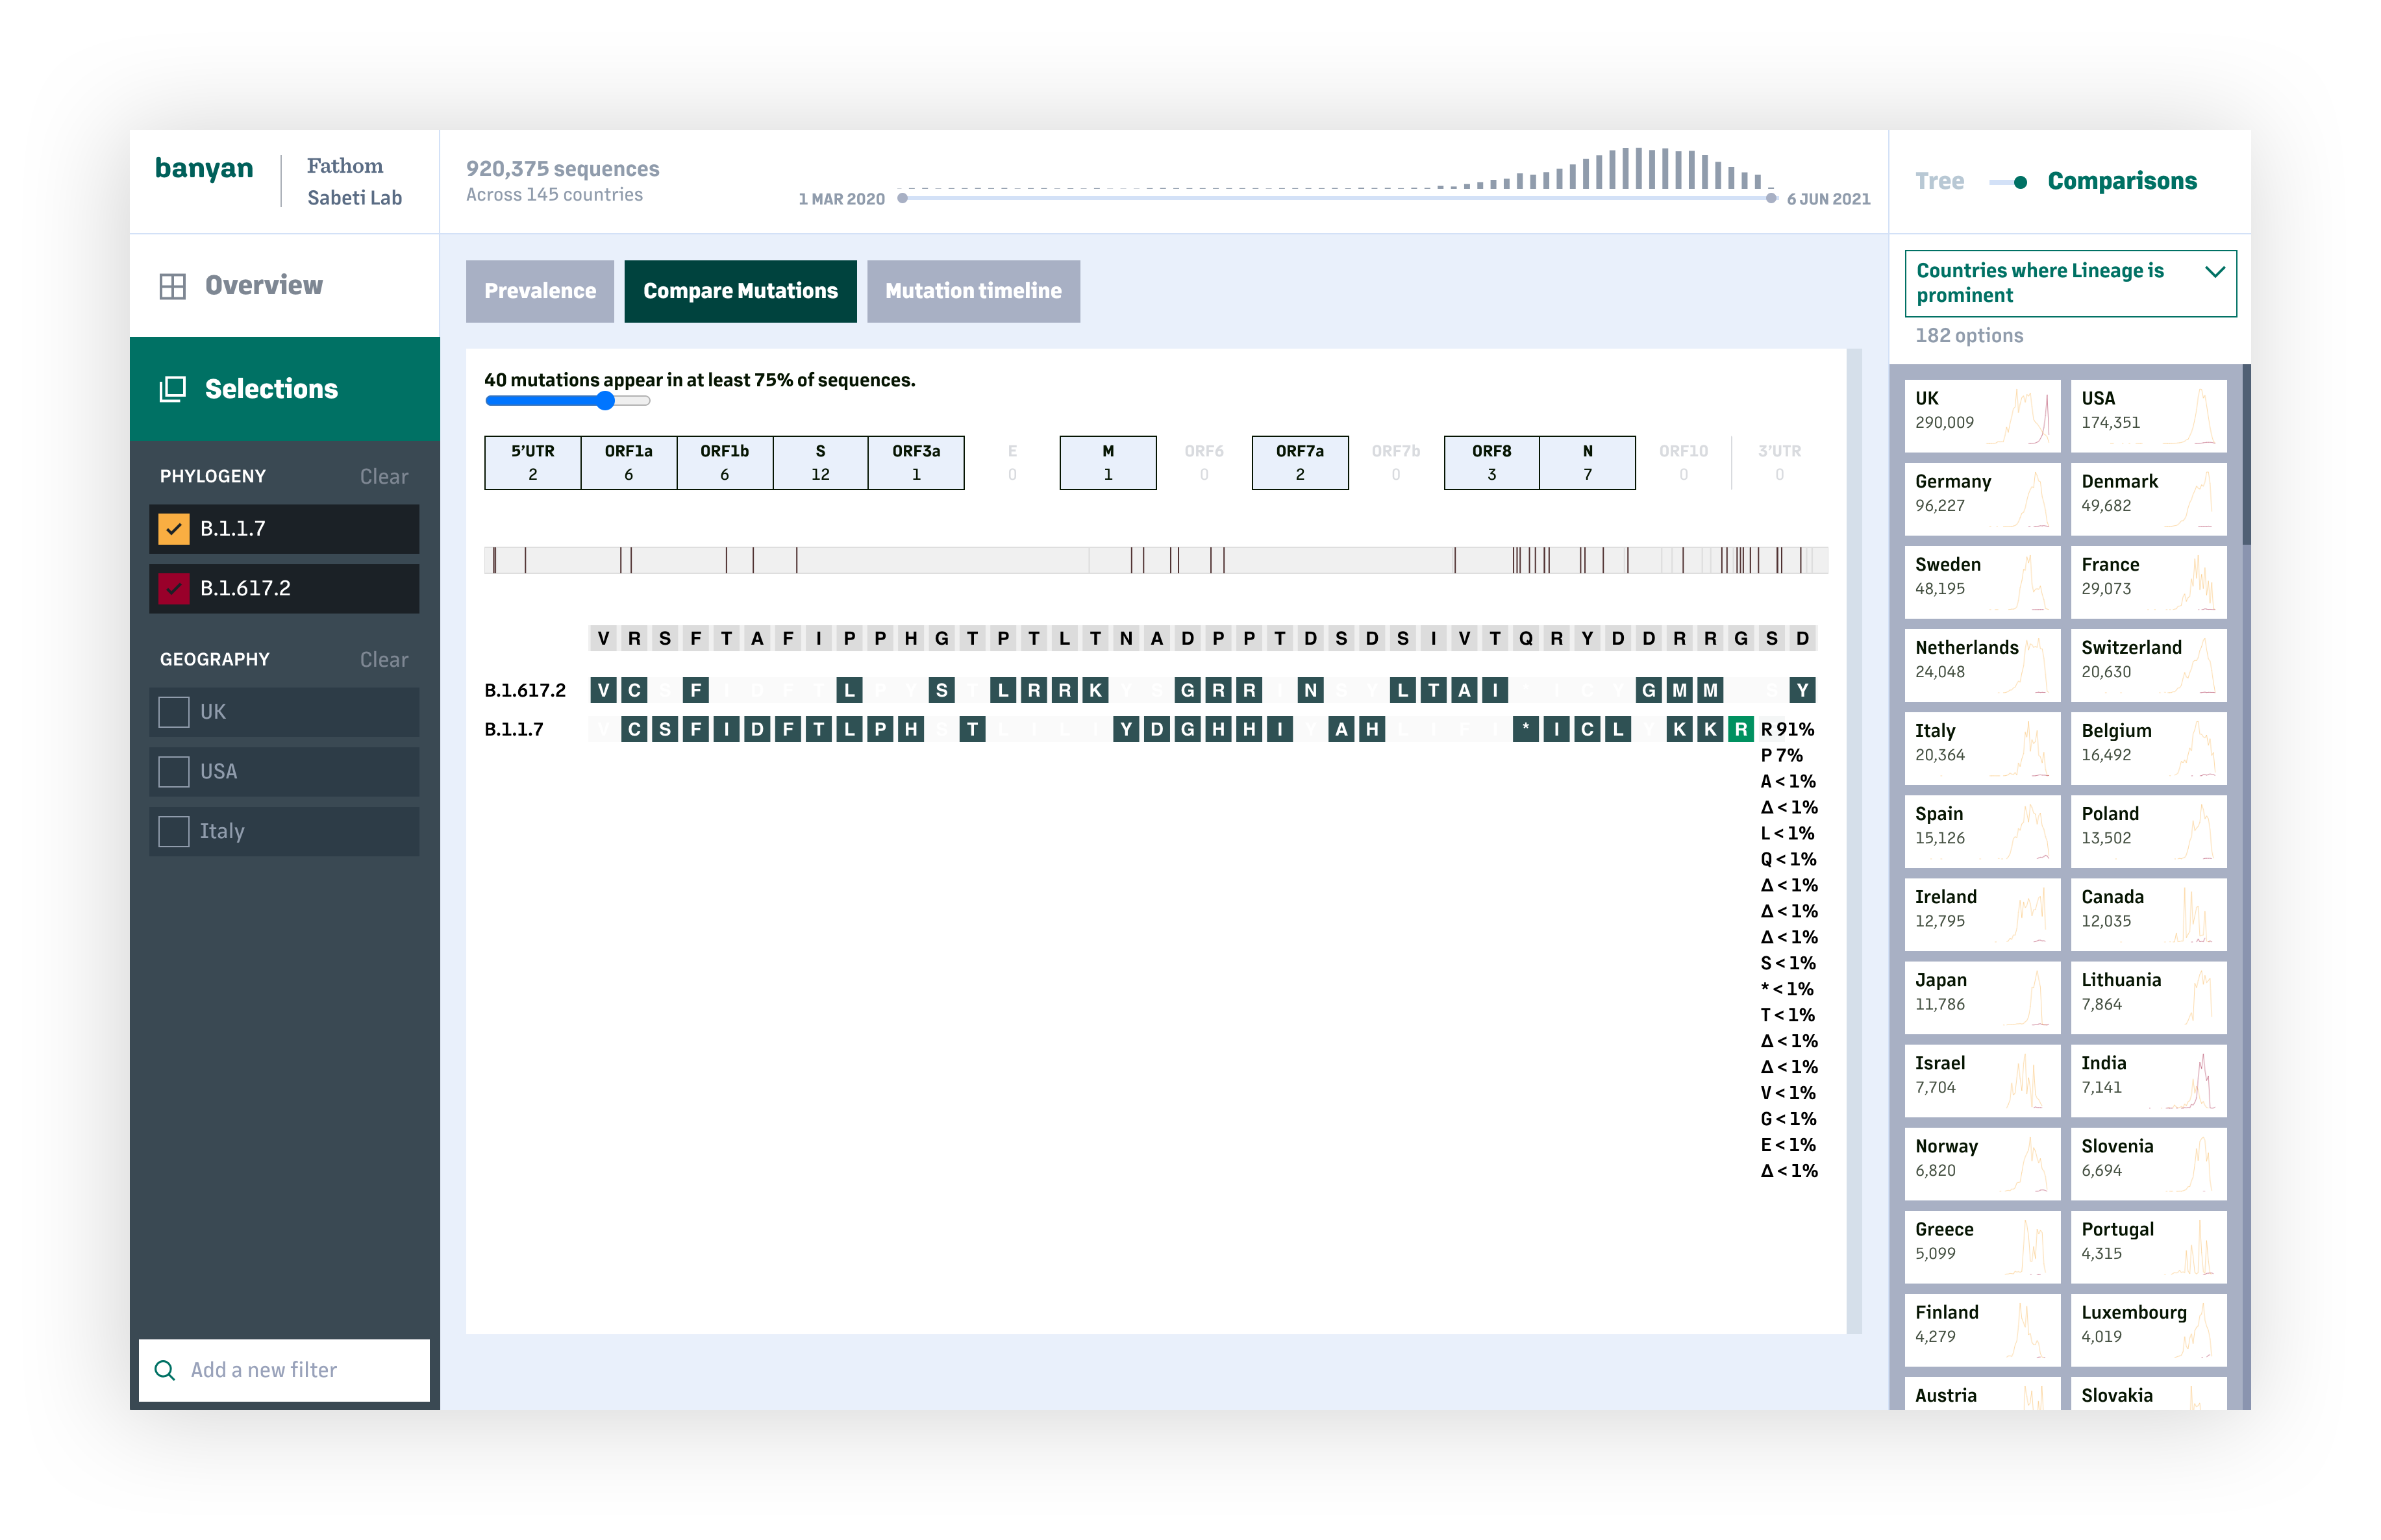
To that end, we have focused on being able to navigate hundreds of thousands of sequences in a phylogenetic tree, and over millions of sequences in the overall dataset. Users are able to choose different points of comparison (geographies, lineages, or a combination) and explore those areas of focus in different views – lineage prevelanace within geographies, mutation prevalance and comparison among lineages, and mutation prevalence over time – to understand at how COVID-19 is developing. (While COVID-19 has been the initial focus for this tool, the same methods can be used for a much wider range of sequencing-related projects.)
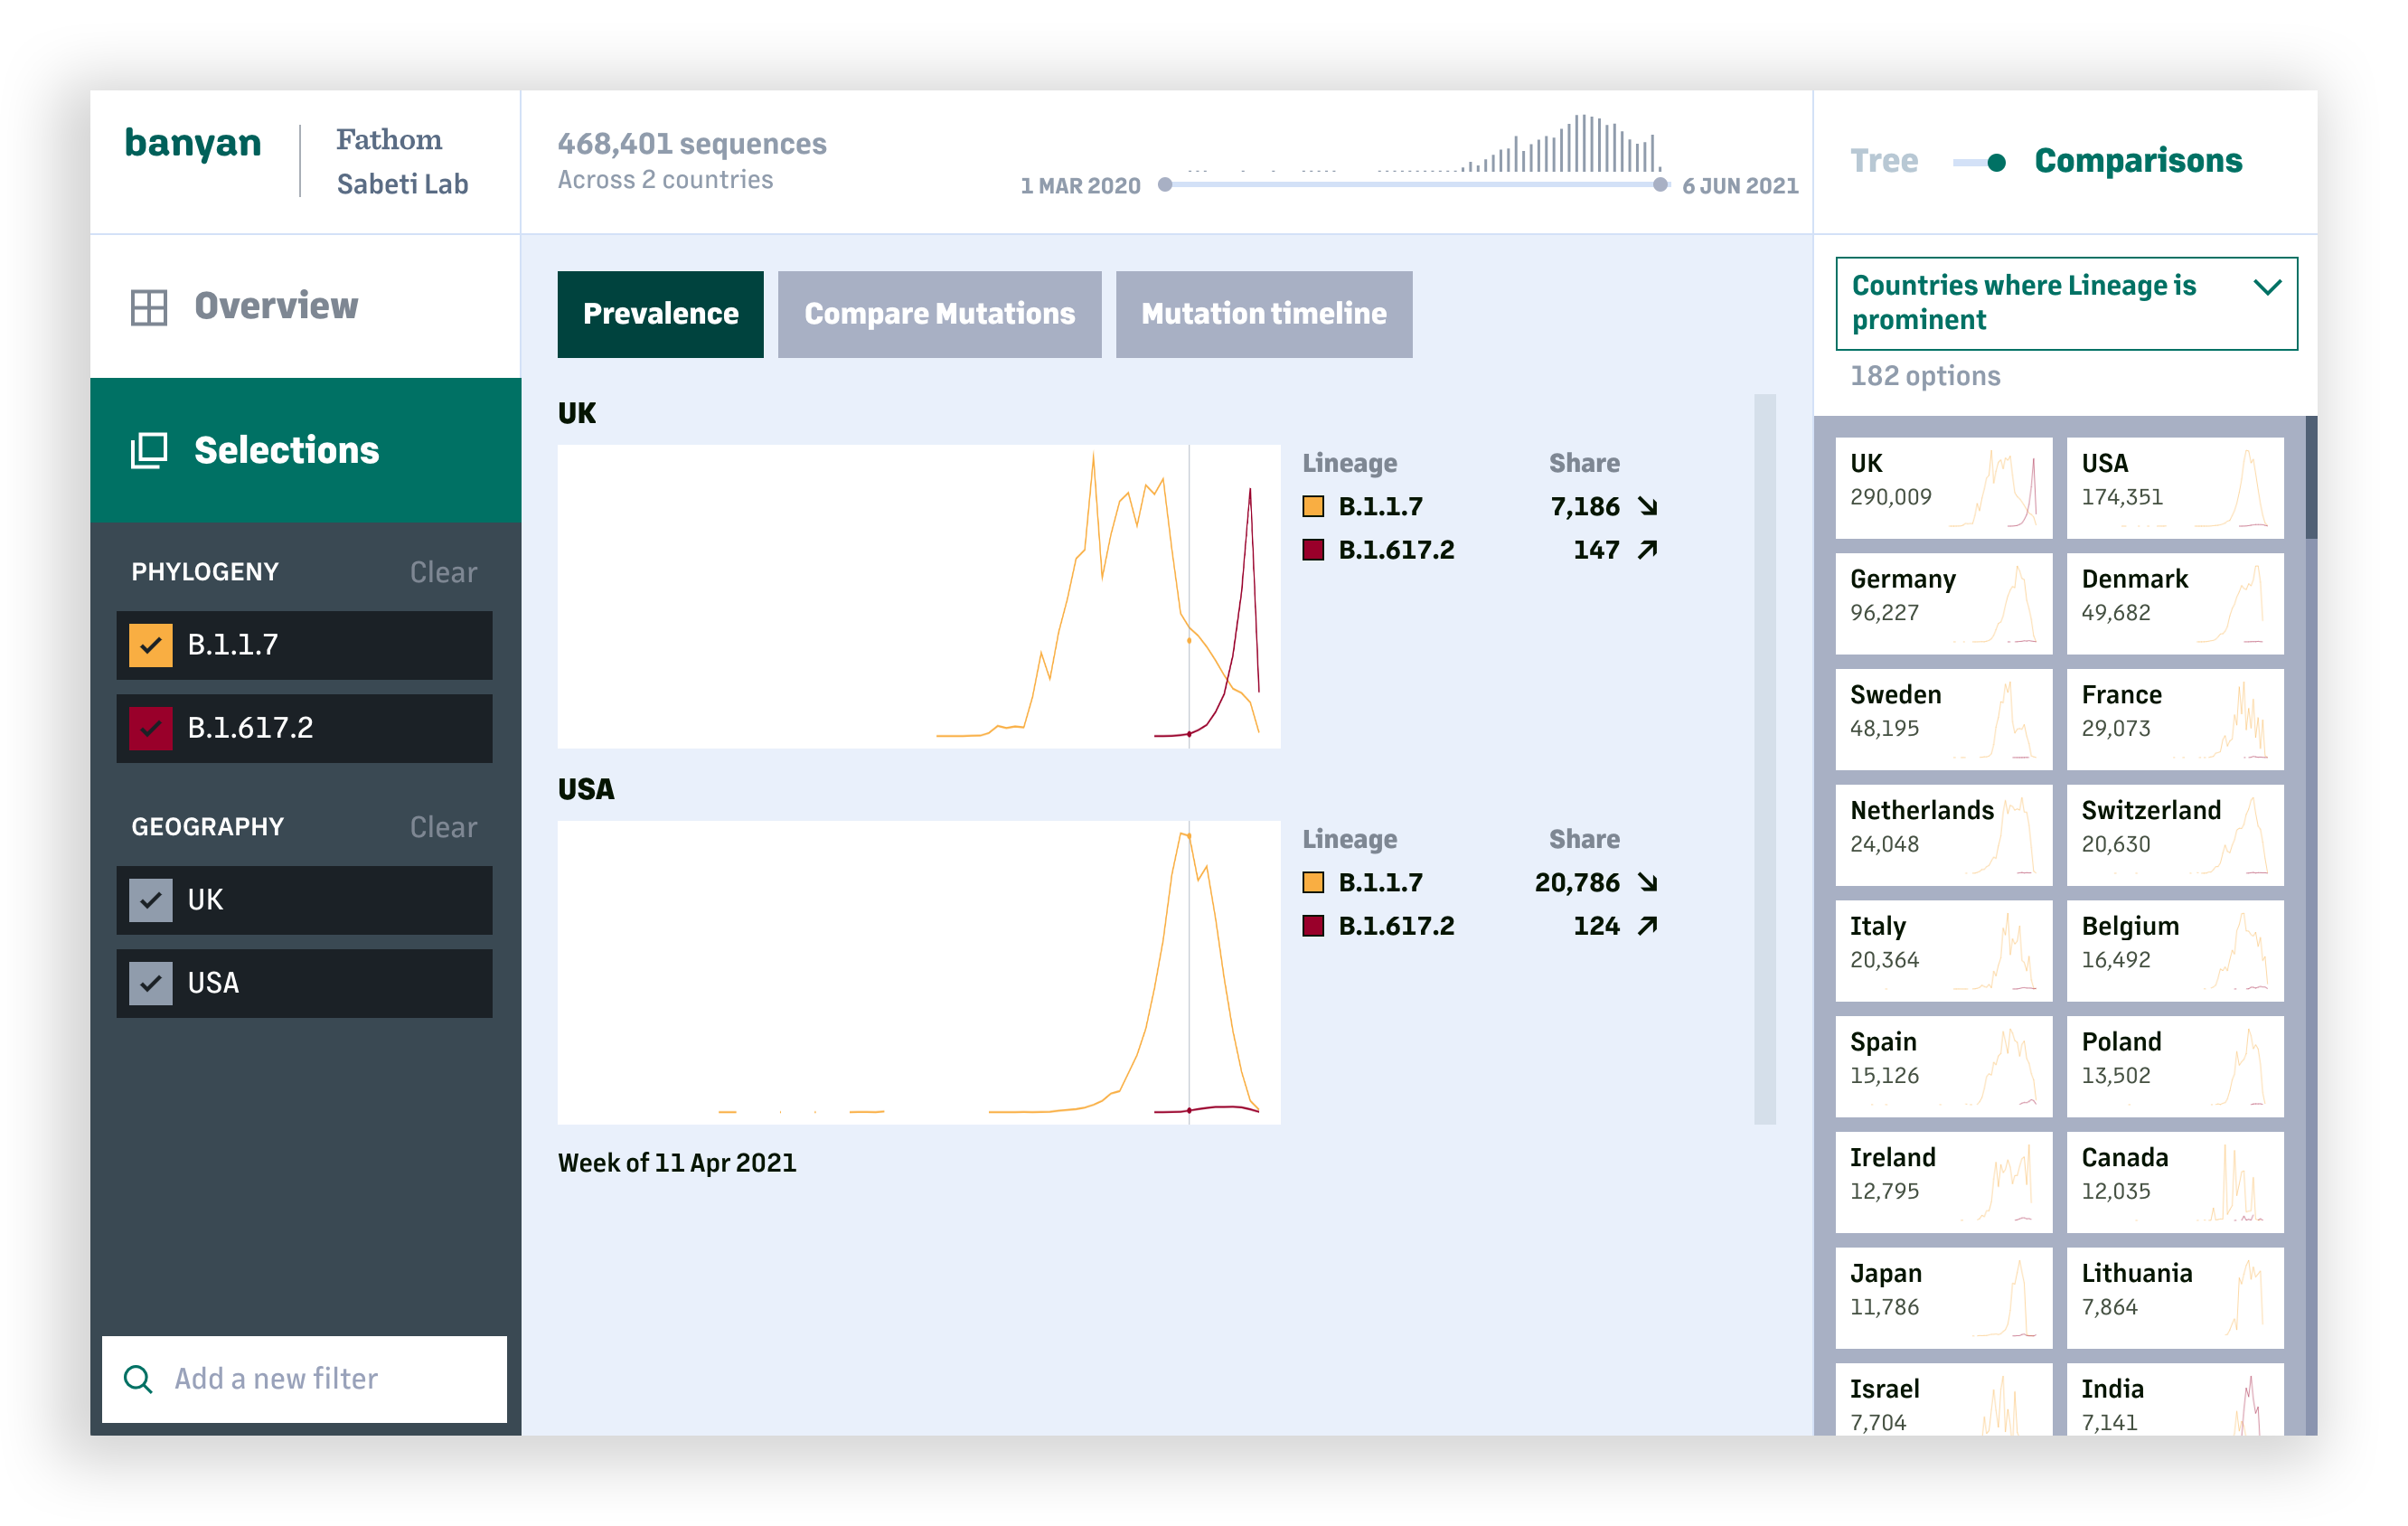
The lineage and mutation timelines provide an overall picture on how COVID-19 has changed at a global or national scale. For deeper analysis, users can look specifically at one or more lineages and compare the prevalance of individual mutations and resulting amino acid changes across sequences within a lineage, or between lineages.
The first release of this tool is the beginning of what we hope will be a continued effort on making the full dataset accessible and actionable.