

The impetus for creating Connected China was Xi Jinping coming to power in 2012. Five years later, President Xi is into his second term. And just last week, the Communist Party proposed the removal of term limits, suggesting that Xi Jinping will remain in office for life.
For all we learned back in 2012, and for all that’s happened in China since, that news was still remarkable. On a basic level, it upended the premise behind the piece, the orderly transition of power that’s happened once in a decade since the 1980s. But also suggested an enormous loss for those working to further reform the government. Or, more ominously, a repudiation of a central tenet of communism, by allowing one person to wield so much power.
And although Connected China was shelved by Thomson Reuters soon after launch, the news of the last week highlights the importance of projects like it, and how its relevance hasn’t diminished in the five years since.
Most of us know very little about China
China has the world’s second largest economy, and also the fastest growing. It is the largest country by population (1.4 billion), yet people in the States (in particular, or the West, more generally) have next to no idea about this country that will play a significant role over the next few decades.
The app has a China 101 section that was originally conceived as just a reference area that provided background. But during user testing, it was the first thing people tapped. Every single person. Even in spite of being tucked away to the side. So after we had “finished,” but still before the release, we did a fairly drastic redesign of the section and also made it the first link on the landing page.
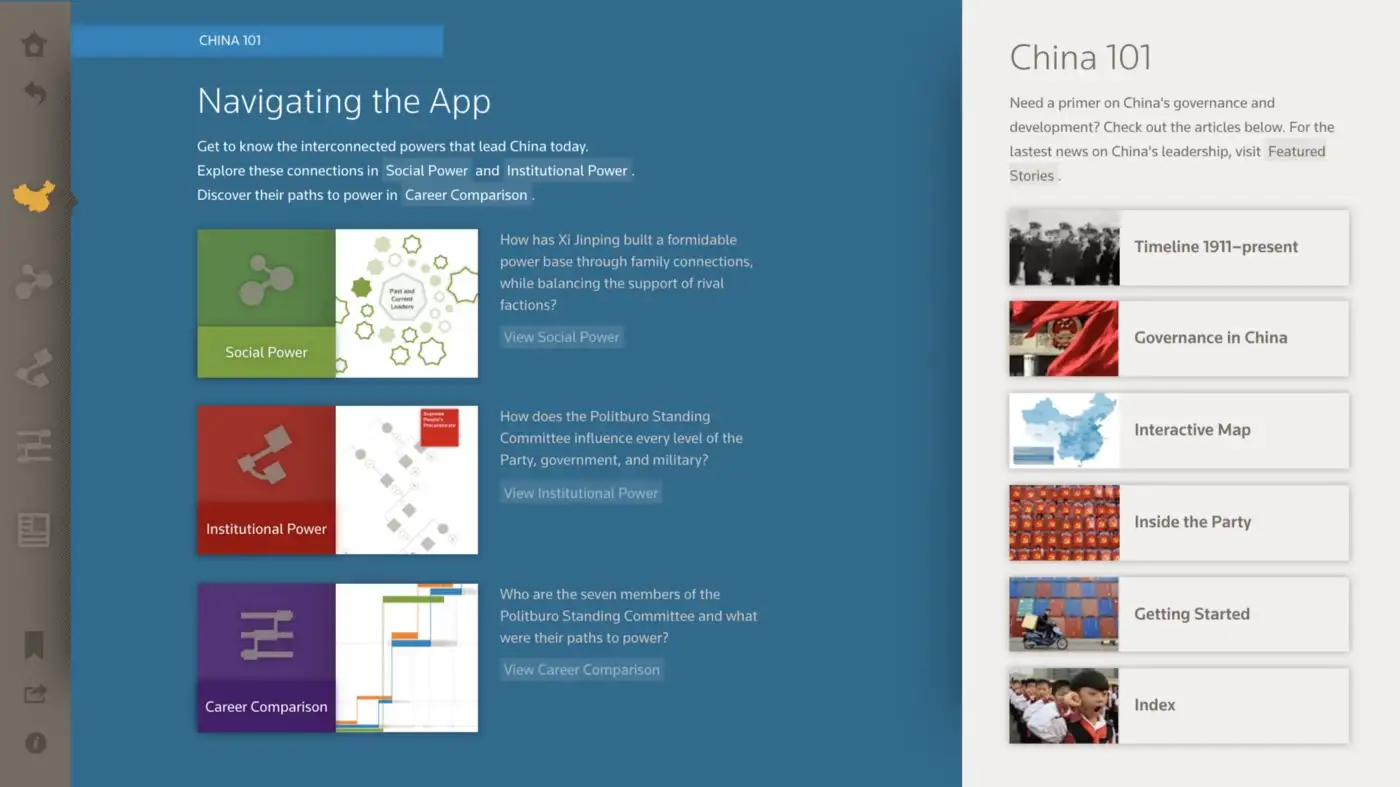
And who are the people who make up China? When it does appear in the news, its 1,403,500,365 inhabitants tend to be painted with the same brush, with the pronouncements of the political leadership assigned to the populace as a whole. Think about it: what’s the last thing you read about China that wasn’t just a statement from the state news agency, President Xi, or his immediate associates? Our window into Chinese culture has been the 2008 Olympics Games (in particular, the opening ceremony), or more recent stories involving warships in the Taiwan Strait, Edward Snowden, and even the Olympics already returning to China in 2022.
When China appears in the news, we rarely have much context
The head of state in the world’s second largest economy has just granted himself perpetual power. What does that mean?
If you’re a president of questionable competence, you might make an awkward and inappropriate jest: “He’s now president for life. President for life. No, he’s great… And look, he was able to do that. I think it’s great. Maybe we’ll have to give that a shot some day.” If we keep this up, we won’t be the largest economy for long.
But some China watchers, including Richard McGregor (whose book helped introduce us to China), write that Xi’s move may signal desperation, rather than confidence. Those cracks in stability seem to be echoed by others who are reporting that not everyone is on board.
Topics like these would have been covered in the Featured Stories section, which was built to be easily updated with new material. Names and entities could be linked to other parts of the app itself for additional context.
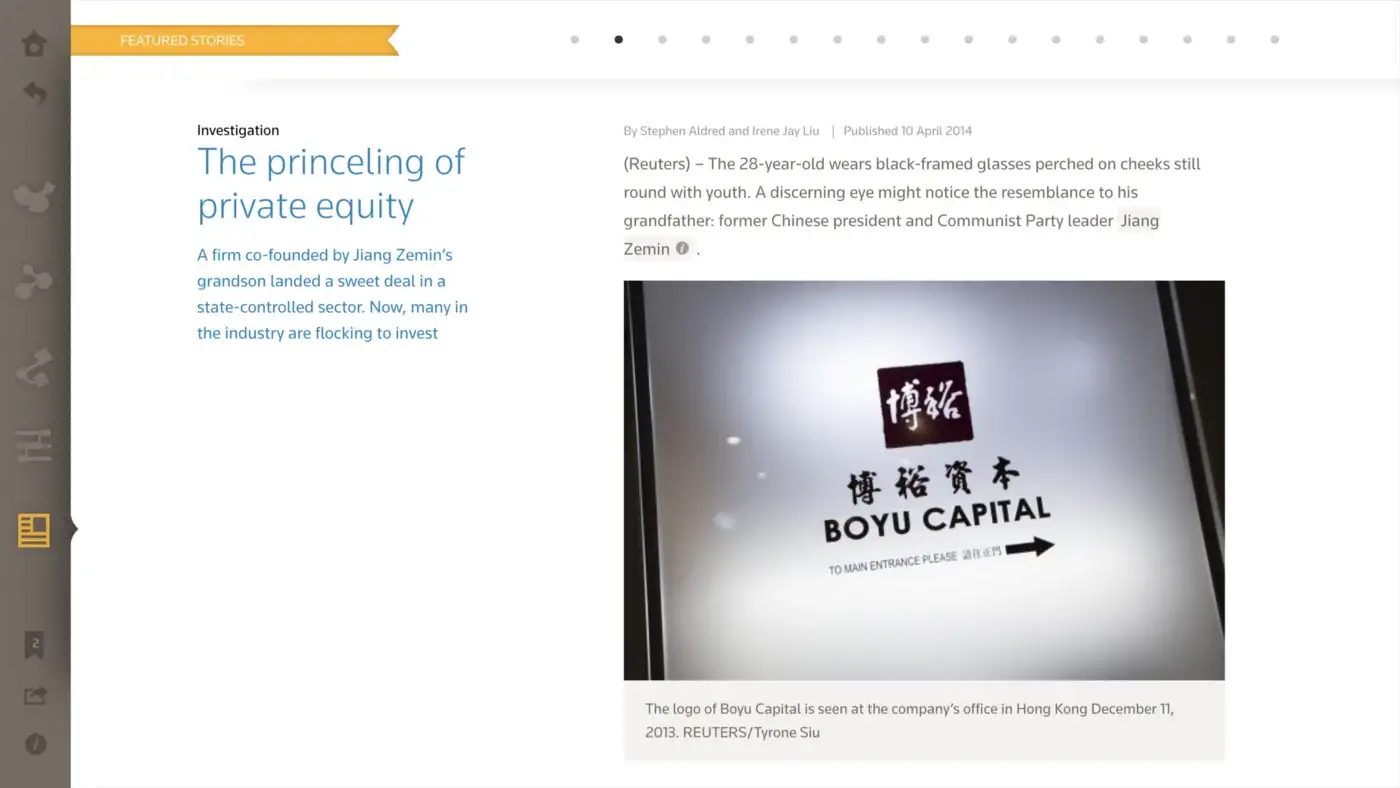
For instance, tapping Jiang Zemin’s name in the screen above would show options to view his social network, where he sits in the various institutions, or to simply read his profile, with a biography, photos, and career details. Viewing his social network would show his connection to current members of senior leadership, and the nature of those connections, and so on.
How do you depict personal connections and influence?
The key to understanding any remotely complex system is the ability to unpack its constituent parts and see how they interact with one another. This has played a role in recent stories like the Panama Papers, the current investigation into Russian involvement in the U.S. election, or anything by Mark Lombardi.
The Social Power view is an attempt to see those influences and to explore the relationships between thousands of people. This is both a necessity to understanding, but also an interesting design problem — how do you show thousands of connections without overwhelming the user?
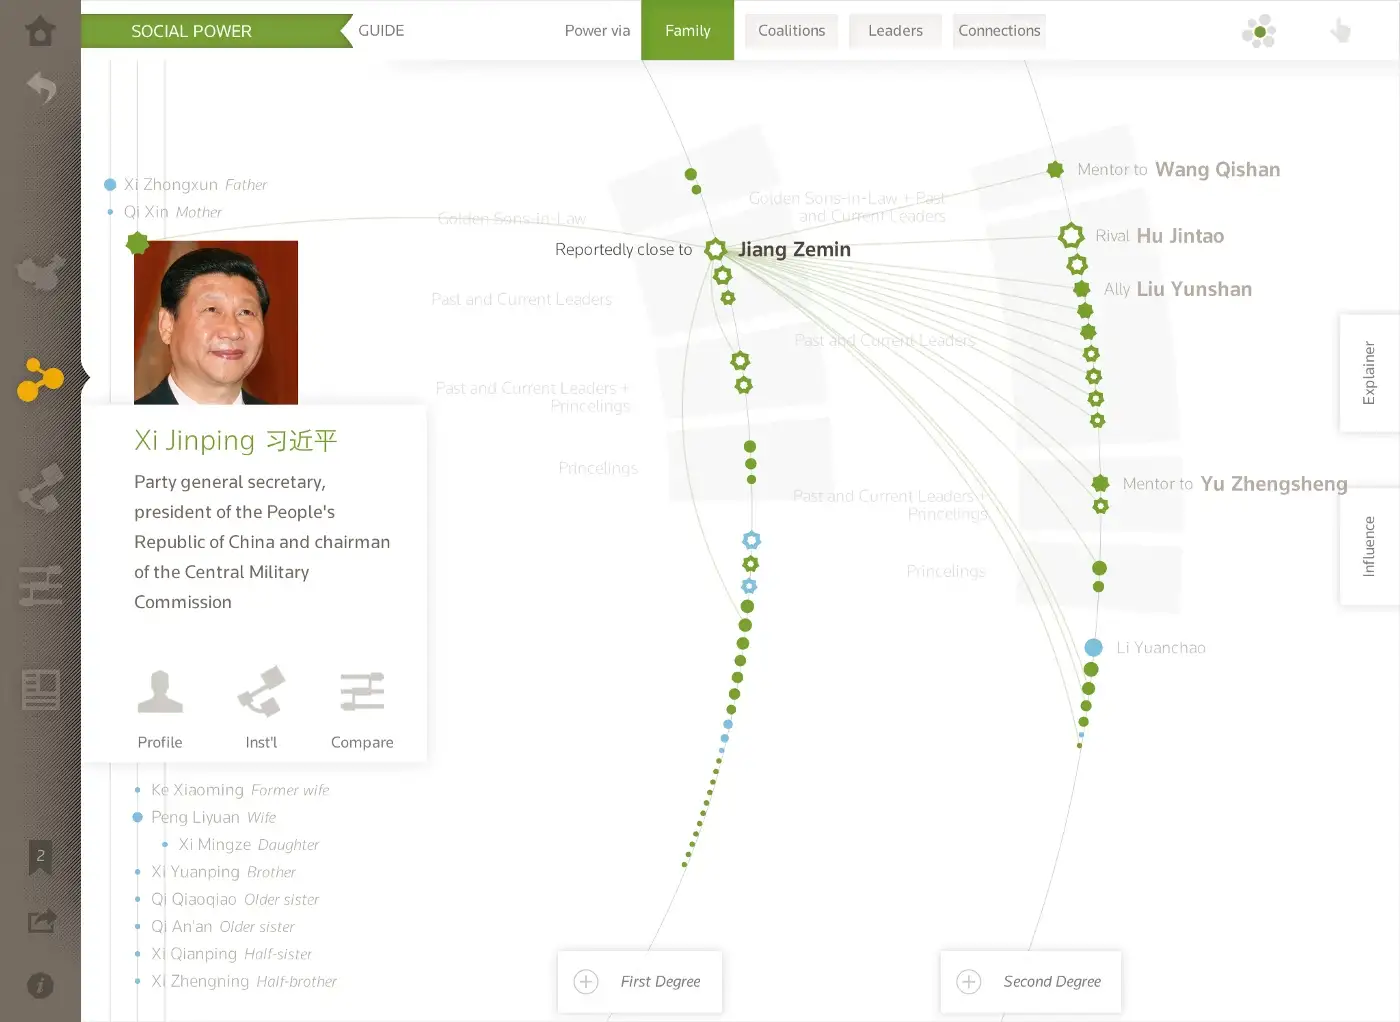
The usual approach is to either make it too simplistic or overly complex. The simplistic version might show a few connections in a simple graphic, or just use a few sentences to verbally explain the connections. The more complex version tends to be a massive interconnected mess that looks like a hairball.
We wanted something a little more in-between: a view of the network that could be easily navigated, with enough complexity to point to the subtleties, but simple enough that the representation wasn’t too in love with itself.
The most important insight was that the network was egocentric, meaning that the stories were about how a single person connected to many others. We also added a peek into the second-degree connections as well: by hovering over Jiang Zemin in the image above, we see the first level of his connections outwards, revealing additional people still in President Xi’s orbit, but slightly removed.
We also realized that even with the simplifications we’d put in place, it would be problematic to drop people into this network without any context. This is a common problem with network visualizations that drop users into the image and say, “Good luck! You’re on your own. Hope you know what you’re looking for!”
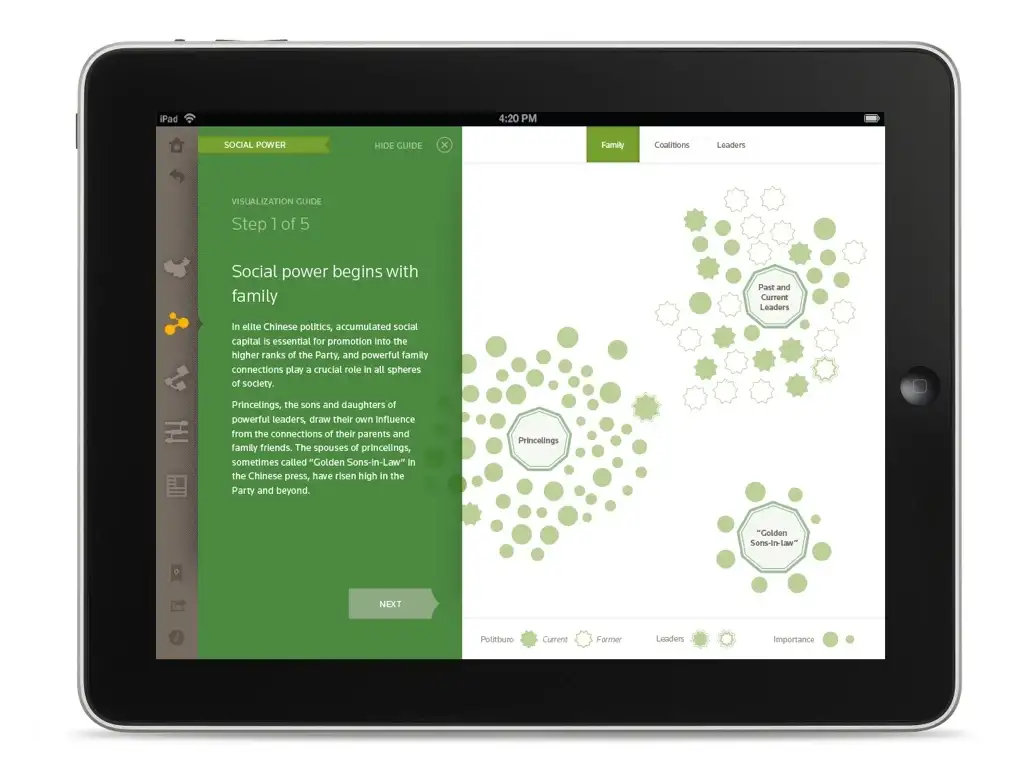
The guide has five steps that walk users through parts of the network, and explain the basics of social power. Along the way, terms like guanxi (accumulation of social capital), kingmakers, and princelings are introduced. These ideas are essential to understanding the culture and will be found in any writing on the topic.
We also did a hairball version of the network early in the process, and to our disappointment, it often gets more attention than the final piece. People just love this stuff (often while simultaneously complaining about how they lack insight).
For a more thorough explanation of the social view, and the design process behind it, we also have a post on our blog.
What’s changed, and how does the data hold up?
In the summer before the 18th Congress (also known as “the summer we were wrapping up the app”), it was announced that there would only be seven members in the next Politburo Standing Committee, instead of nine. This indicated a concentration of political power among fewer people.
It’s hard to explain what a significant change this was, except to say that “The Nine” was considered a potential name for the app itself.
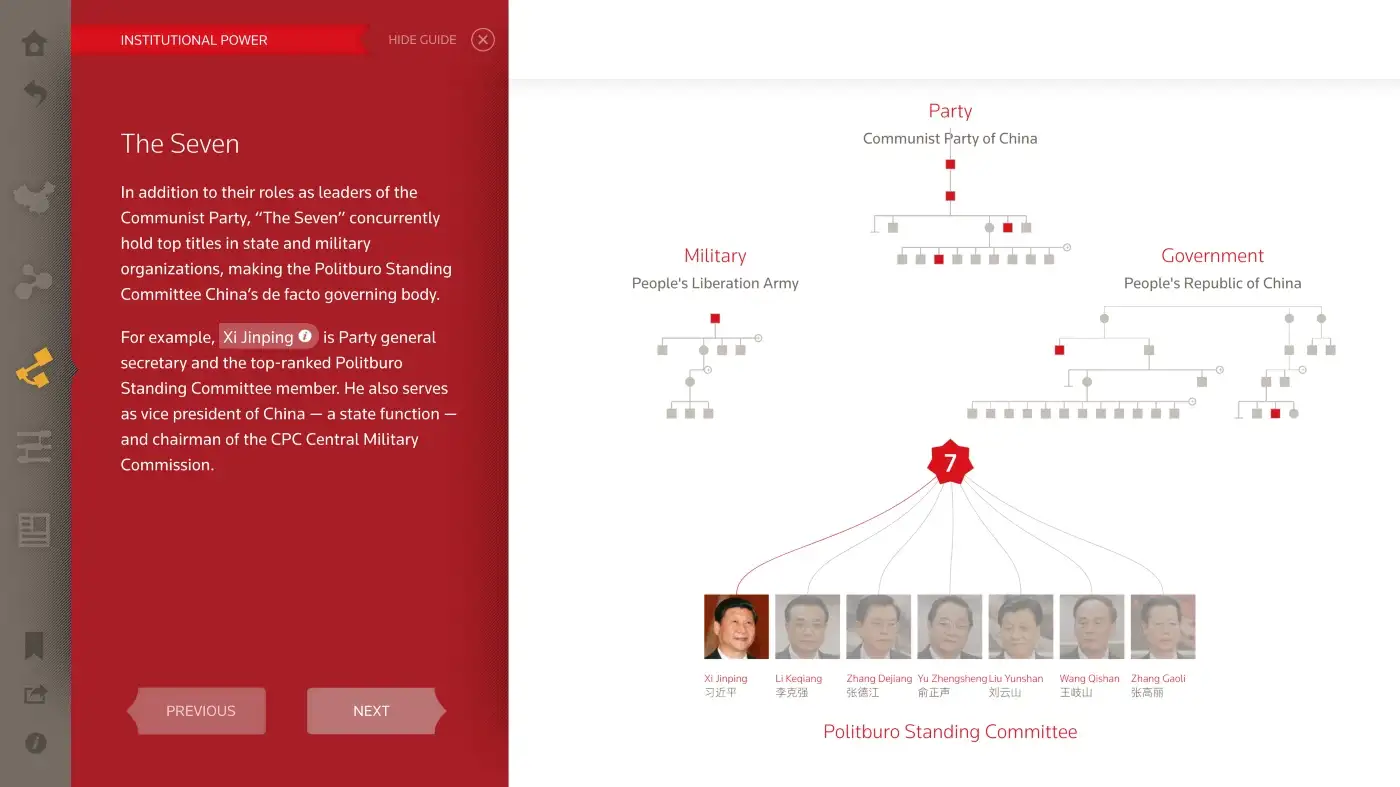
Furthermore, the incoming members to the PBSC were all of the age that they would only serve one term before forced retirement due to age limits. This broke with past norms, where incoming members could serve two or more terms to help ensure experience when power eventually transitioned. This set the stage for five new vacancies to be filled at the 19th Congress in 2017.
The 19th congress was last October, and President Xi was able to concentrate enough power that he filled those slots with people loyal to him. Although the data for Connected China hasn’t been updated since 2013, the five new members of the PBSC — Li Zhanshu, Wang Yang, Wang Huning, Zhao Leji, and Han Zheng — are all identified in the app as Rising Stars.
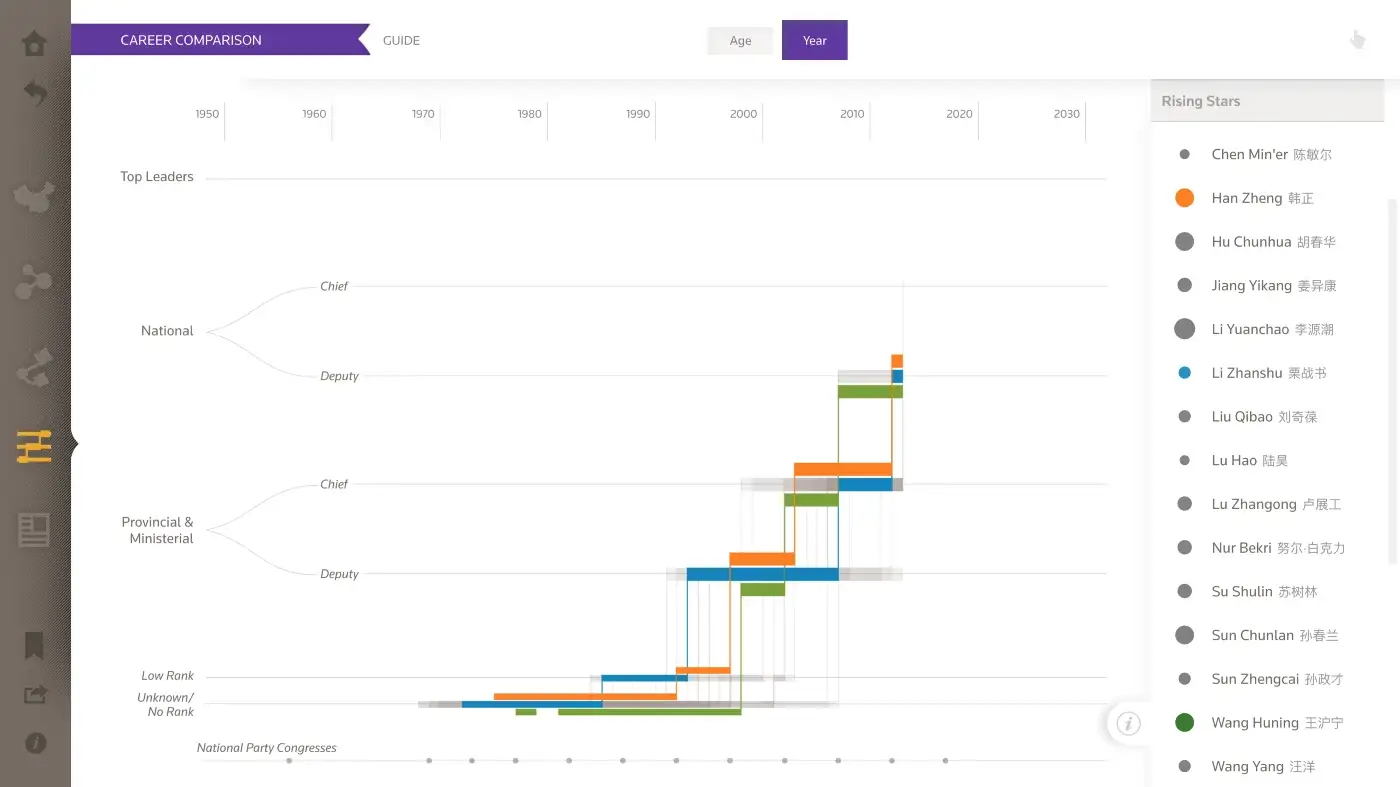
At the time, their social networks were not filled out broadly, yet each features relationships with current or former leaders.
A platform is only as good as its malleability
Platforms like these are only useful if they’re updatable, as (painfully) proven late in the project by the change from nine to seven Politburo Standing Committee members because of a scandal involving Bo Xilai.
The entire system was built to handle up-to-the-minute updates, not just to the editorial content, but for the underlying data as well. In fact, because the data was being collected in parallel while we worked on the project, less than a third of the final information was available as we developed the design. This has considerations at several layers:
- How do you make the visual design flex to handle more data? Answer: by testing lots of different inputs and tons of iteration.
- How do you deploy updates efficiently on a potentially high-traffic site? With a system that can deploy new updates to production as easily as you can roll back to previous revisions.
- How do you make a system like this scale for any number of users? We developed a way for the entire site to be completely static so it could be served up by a CDN—several years before this became as common as it is today.
All this architecture isn’t obvious to users, which is how we prefer it. It’s more problematic from a business standpoint, though, because it means we don’t get much credit for it: if we had shipped the project with the hairball version of the network, in all its complexity, would the project have received more attention and hype as a big data platform for understanding China? Perhaps.
“Medium” Data?
I don’t really see this as a big data project—even with thousands of entities, 30,000 connections between them, and a quarter million words of text—but neither is it such a limited amount of data that it can be considered “small.”
All those thousands of data points were hand-curated, edited, and manually derived from publicly available data sources by Irene and her team at Thomson Reuters. It wasn’t just wiring up to an API and hoping we got useful results, instead, she led a team of journalists who carefully assembled all of the entities, connections, and context necessary to tell a compelling story.
The process was a stark contrast to the vast majority of data-driven work, which is drastically biased toward source data that are easily available and online. The collaboration with Irene and her team of domain experts was central to our interest in the project. Their domain expertise provided the necessary editorial lens through which to understand what we were seeing in the data. This ranged from back-and-forth conversations over email with the team to Irene sitting next to Mark in the studio, barking “more of this, less of that,” while he had an editor window open and was tweaking the code.
The legwork behind good data projects is under-appreciated, and a poorly understood or acknowledged priority.
The Big Con
I’ve often said that my favorite thing about design is that it’s a means to perpetually convert your curiosities into “work.” (Where “work” means a grown up, adult thing that you get paid for. Or at least has plausible cover.)
This project was a chance to learn about China in a way that we couldn’t have made time for on our own — and we wouldn’t have had the guidance of domain experts like the team at Reuters who told us where to look and how to interpret what we were seeing.
What I enjoy about both design and code (and writing) is that they are means for taking things apart and understanding them. And while understanding information is my central interest, the experience on this project wasn’t much different from taking apart telephones as a seven-year-old, mixing and rematching their parts to understand how they worked. And while five years later, changes in technology and the changes in China present new opportunities for the app, I hope it’s representative of our intense curiosity, and enough to pique your interest.
Thanks to Mark Schifferli for help preparing this piece.
Read More
A few links for those who would like to dig deeper:
- Richard McGregor’s The Party is an engaging, well-written introduction to modern China
- An in-depth presentation of this project at the Eyeo Festival in 2013
- China watchers and writers on Twitter: Mike Forsythe, Zhou Xin, Melissa Chan, the previously mentioned Richard McGregor, and, uh, The Relevant Organs
- A collection of links from Mark Hurst: Why you need to pay attention to China and its technology