Signing up is free and takes a few seconds.
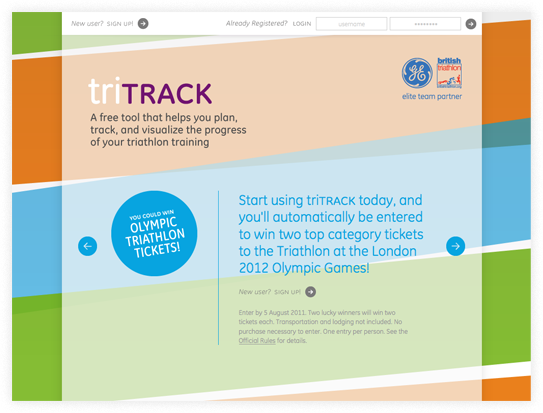
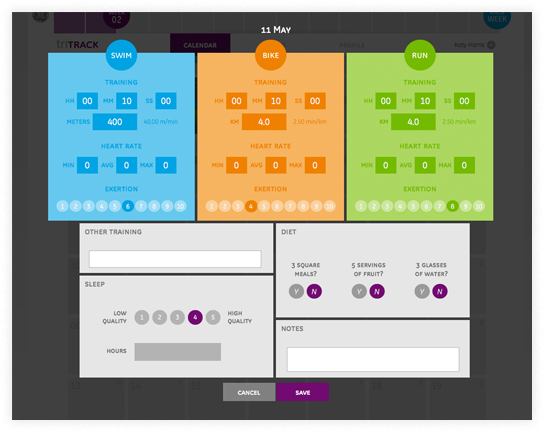
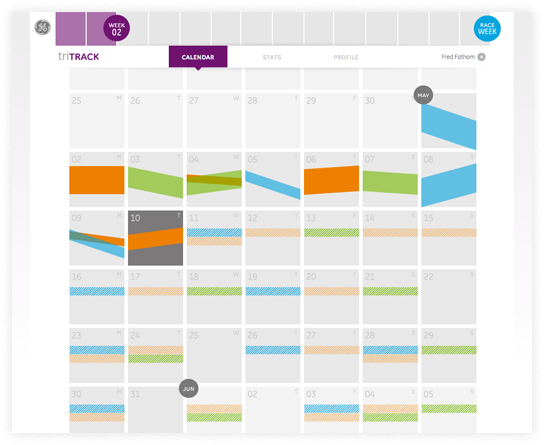
TriTrack stores time, pace, distance, and diet for your exercise program...
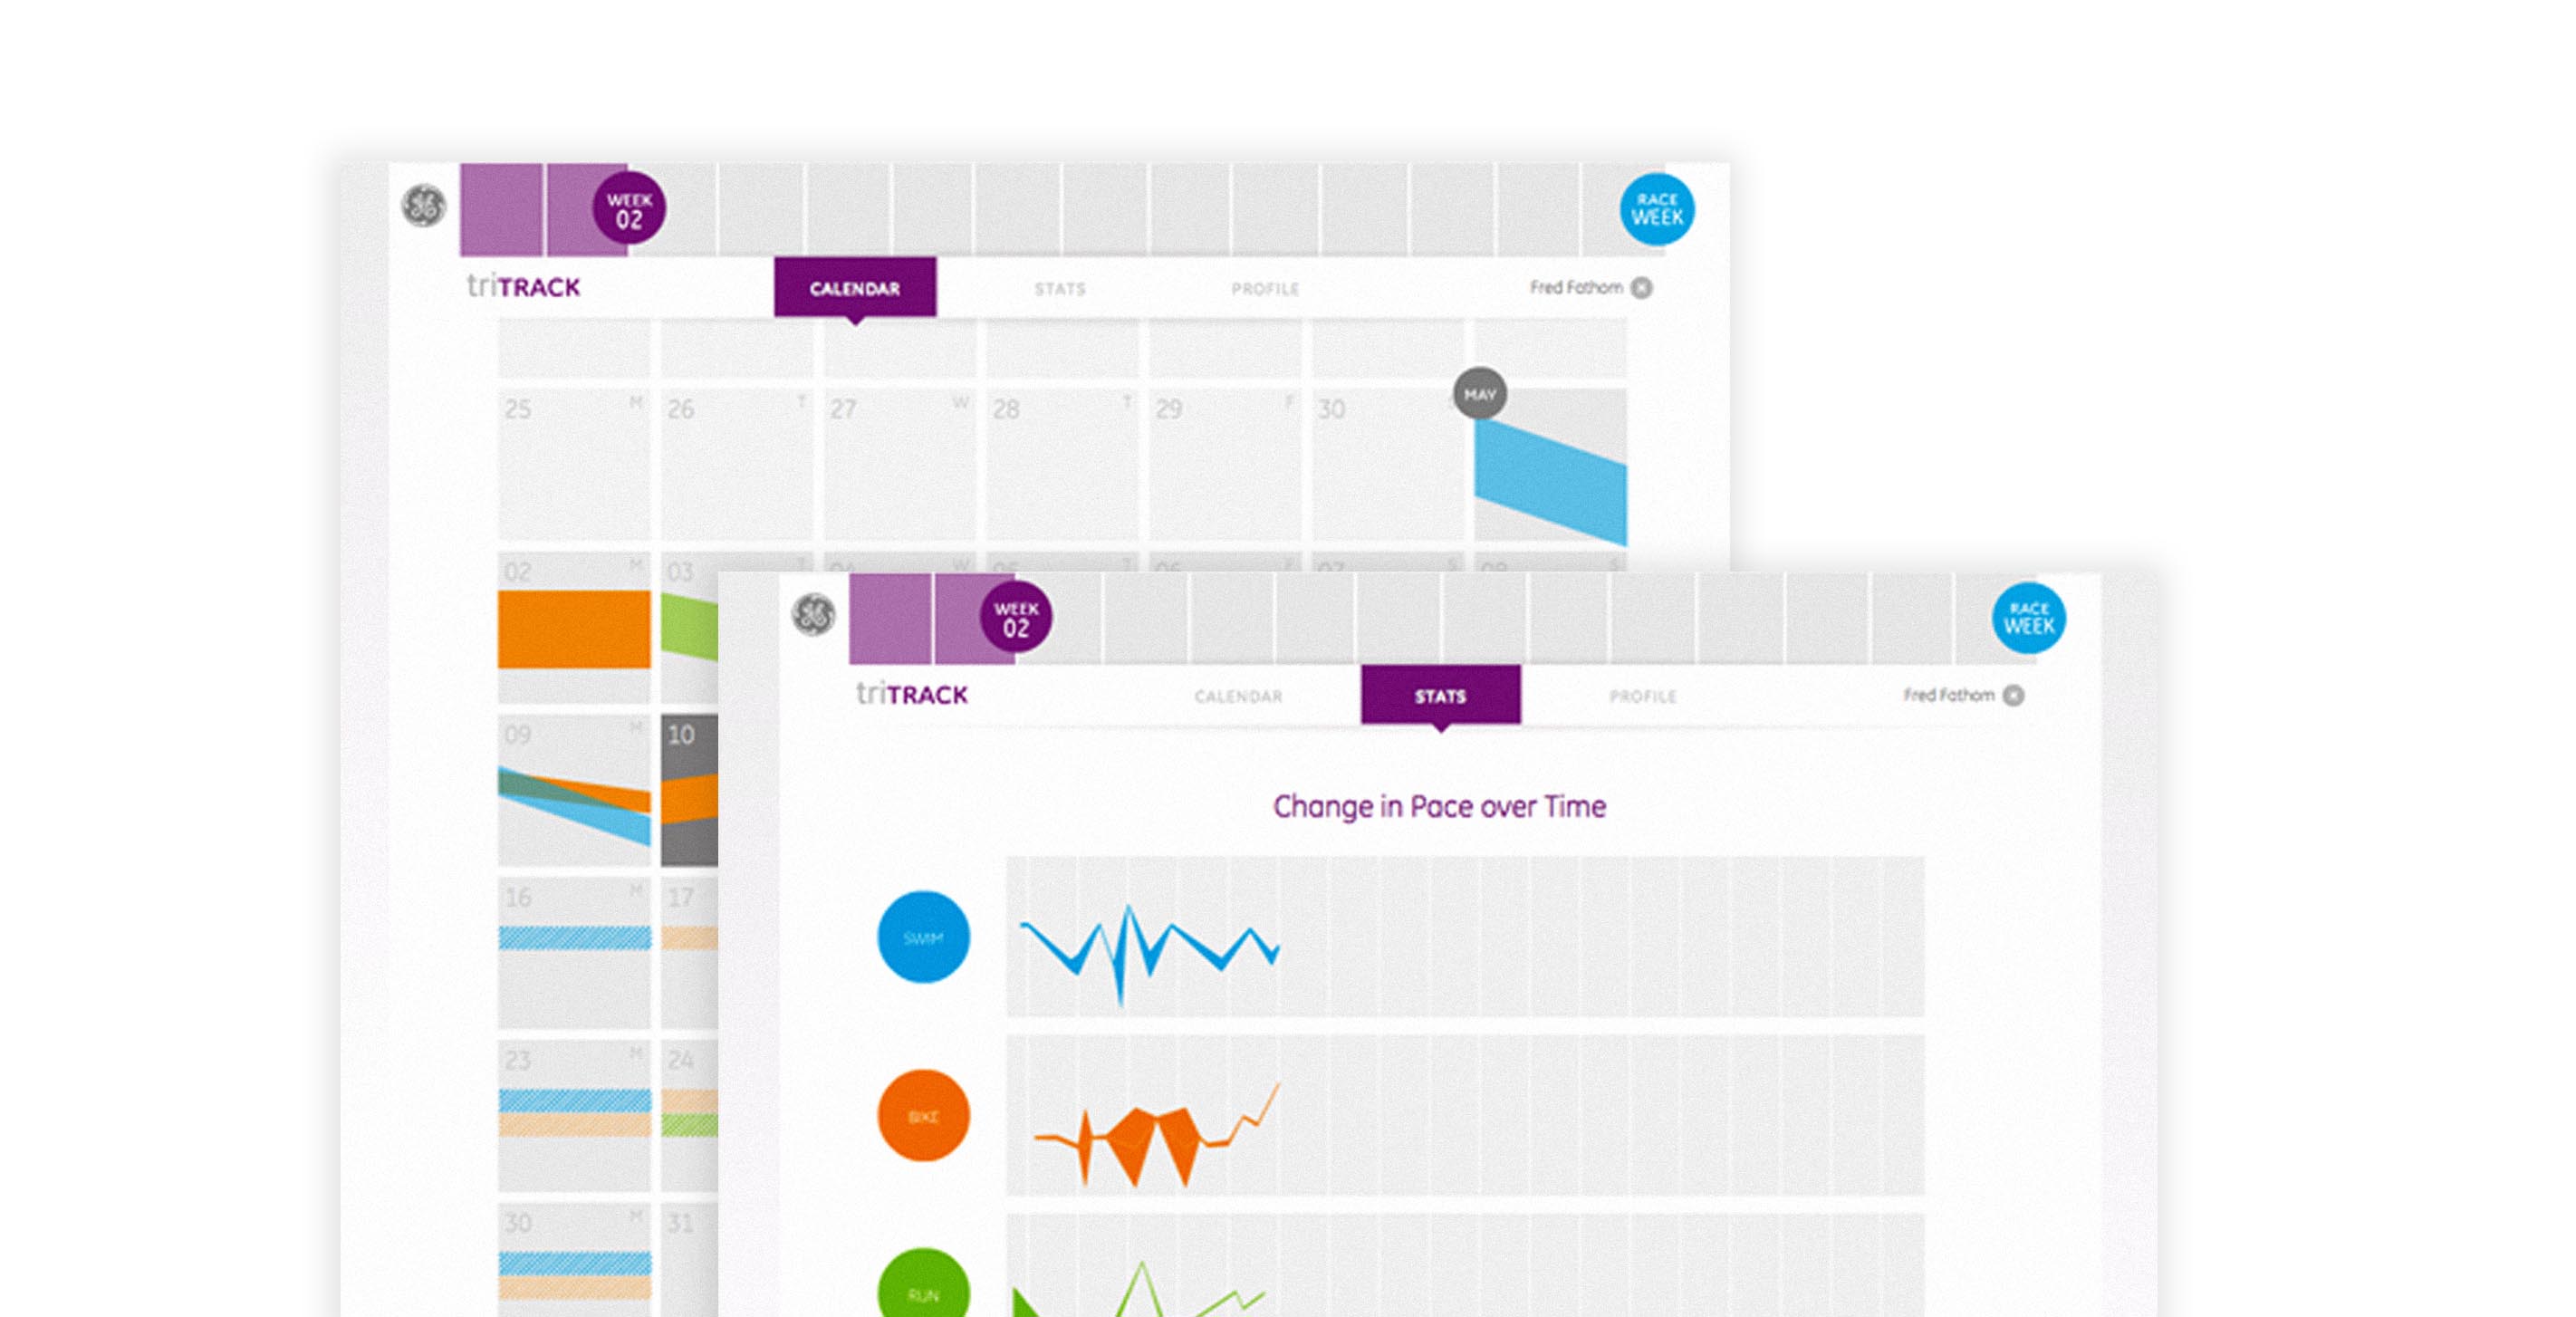
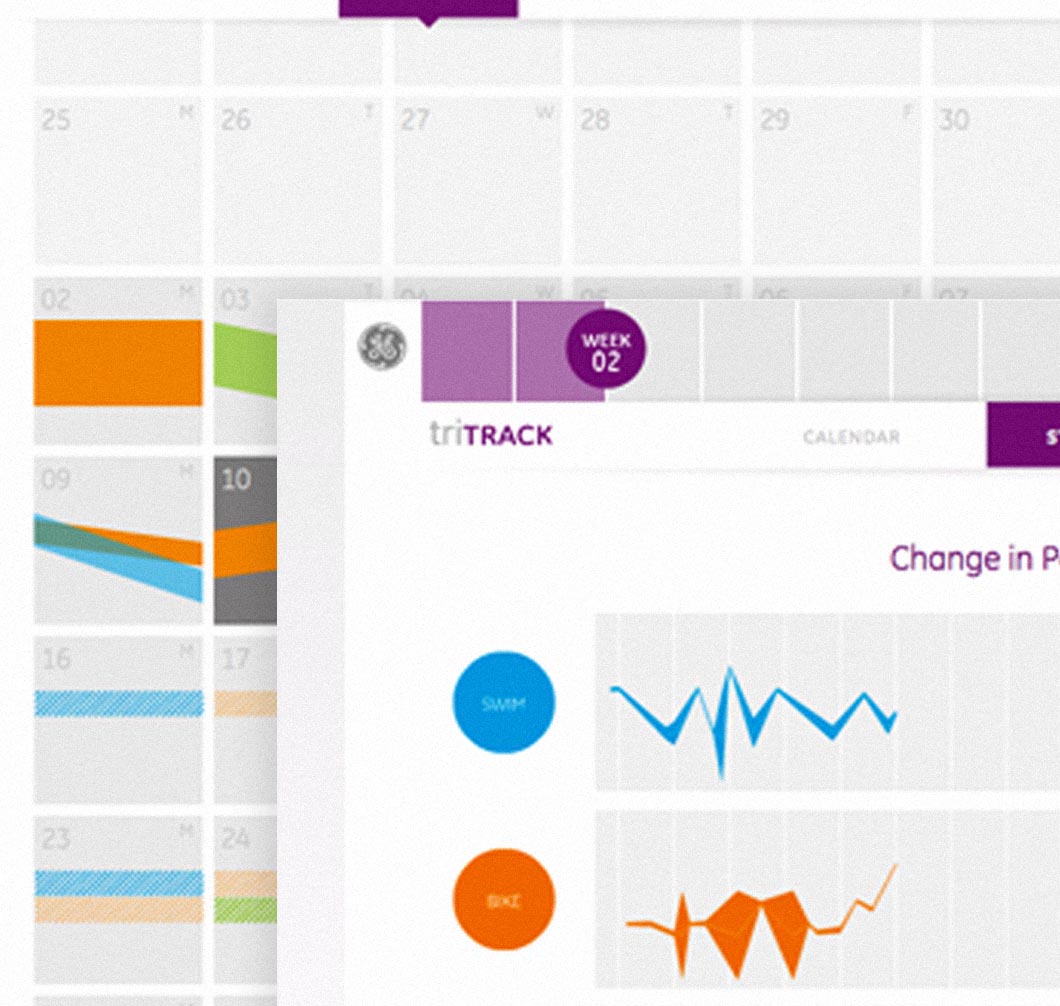
...and visualizes your progress.
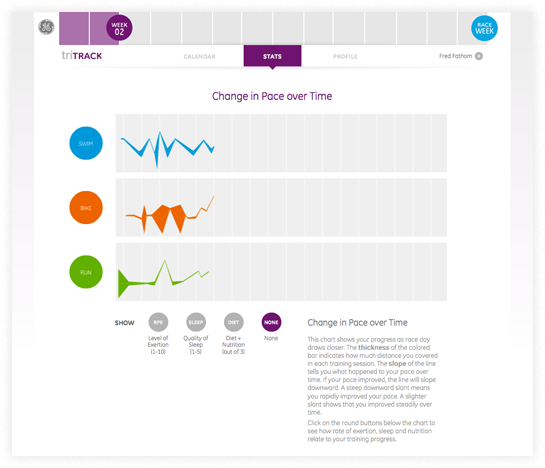
The thickness of the colored bar indicates how much distance you covered in each training session. The slope of the line tells you what happened to your pace over time. If your pace improved, the line will slope downward. A steep downward slant means you rapidly improved your pace. A slighter slant shows that you improved steadily over time.
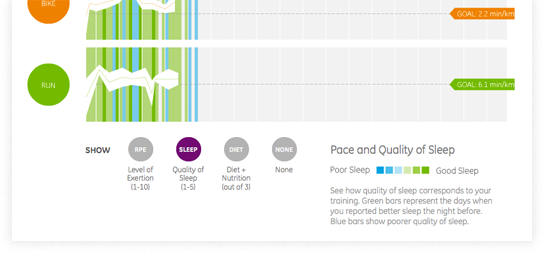
You can also see Pace and Level of Exertion, Pace and Quality of Sleep, and Pace and Diet+Nutrition. Each colored bar represents a day.
Level of exertion is represented with a color spectrum that goes from blue (lower exertion) to green (higher exertion).
How quality of sleep corresponds to your training is shown by green bars for the days when you reported better sleep the night before. Blue bars show poorer quality of sleep.
For nutrition, green bars indicate that you checked off all the diet and nutrition benchmarks mentioned on the training entry form (three square meals, five servings of fruit and three glasses of water). Blue bars show days where you reached none of these benchmarks. The gradient in between, indicate that the three goals were partially met.
Also tracked by TriTrack:
- Time Trained per Week
- Total time (in minutes) per week that you've spent training.
- Time Trained per sport per week
- Time (in minutes) that you’ve spent on each of the three activities—swimming, biking and running.