For example, some plants can’t stand to be below freezing (zone 11), while others do just fine at -20 Fahrenheit (zone 5). In the U.S., zones range from 0 to 12, where zone 0 is for plants that can survive in temperatures lower than -60 F, zone 1 is for plants hardy down to -60 F, zone 2 is for -50, etc., up to zone 12 where a plant can't go below 50 F. Getting a plant's hardiness zone right doesn’t guarantee its survival, but letting it spend the winter in a zone that's too low is a pretty sure way to kill it.
The problem with hardiness zones is that most available guides are based on twenty-year-old data. And rising temperatures in the past twenty years have redrawn the map of hardiness zones in the U.S. To get our mitts on more current data, we sifted through data available from the National Oceanic and Atmospheric Administration, and took the average annual minimum temperature of the past 10 years to determine up to date hardiness zones. Compared to 1980-1990, it looks like the U.S. is on average about 3 degrees warmer.
And to bring it home for you, our intrepid planting public, we whipped together this little app to let you know what zone you're in. It uses html5 geolocation to find your latitude and longitude, and then takes the average zone from the 10 nearest weather stations to estimate your zone.
-- Ed. Note: This project is down for repairs. In the interim, please get in touch with any questions!
Technical notes
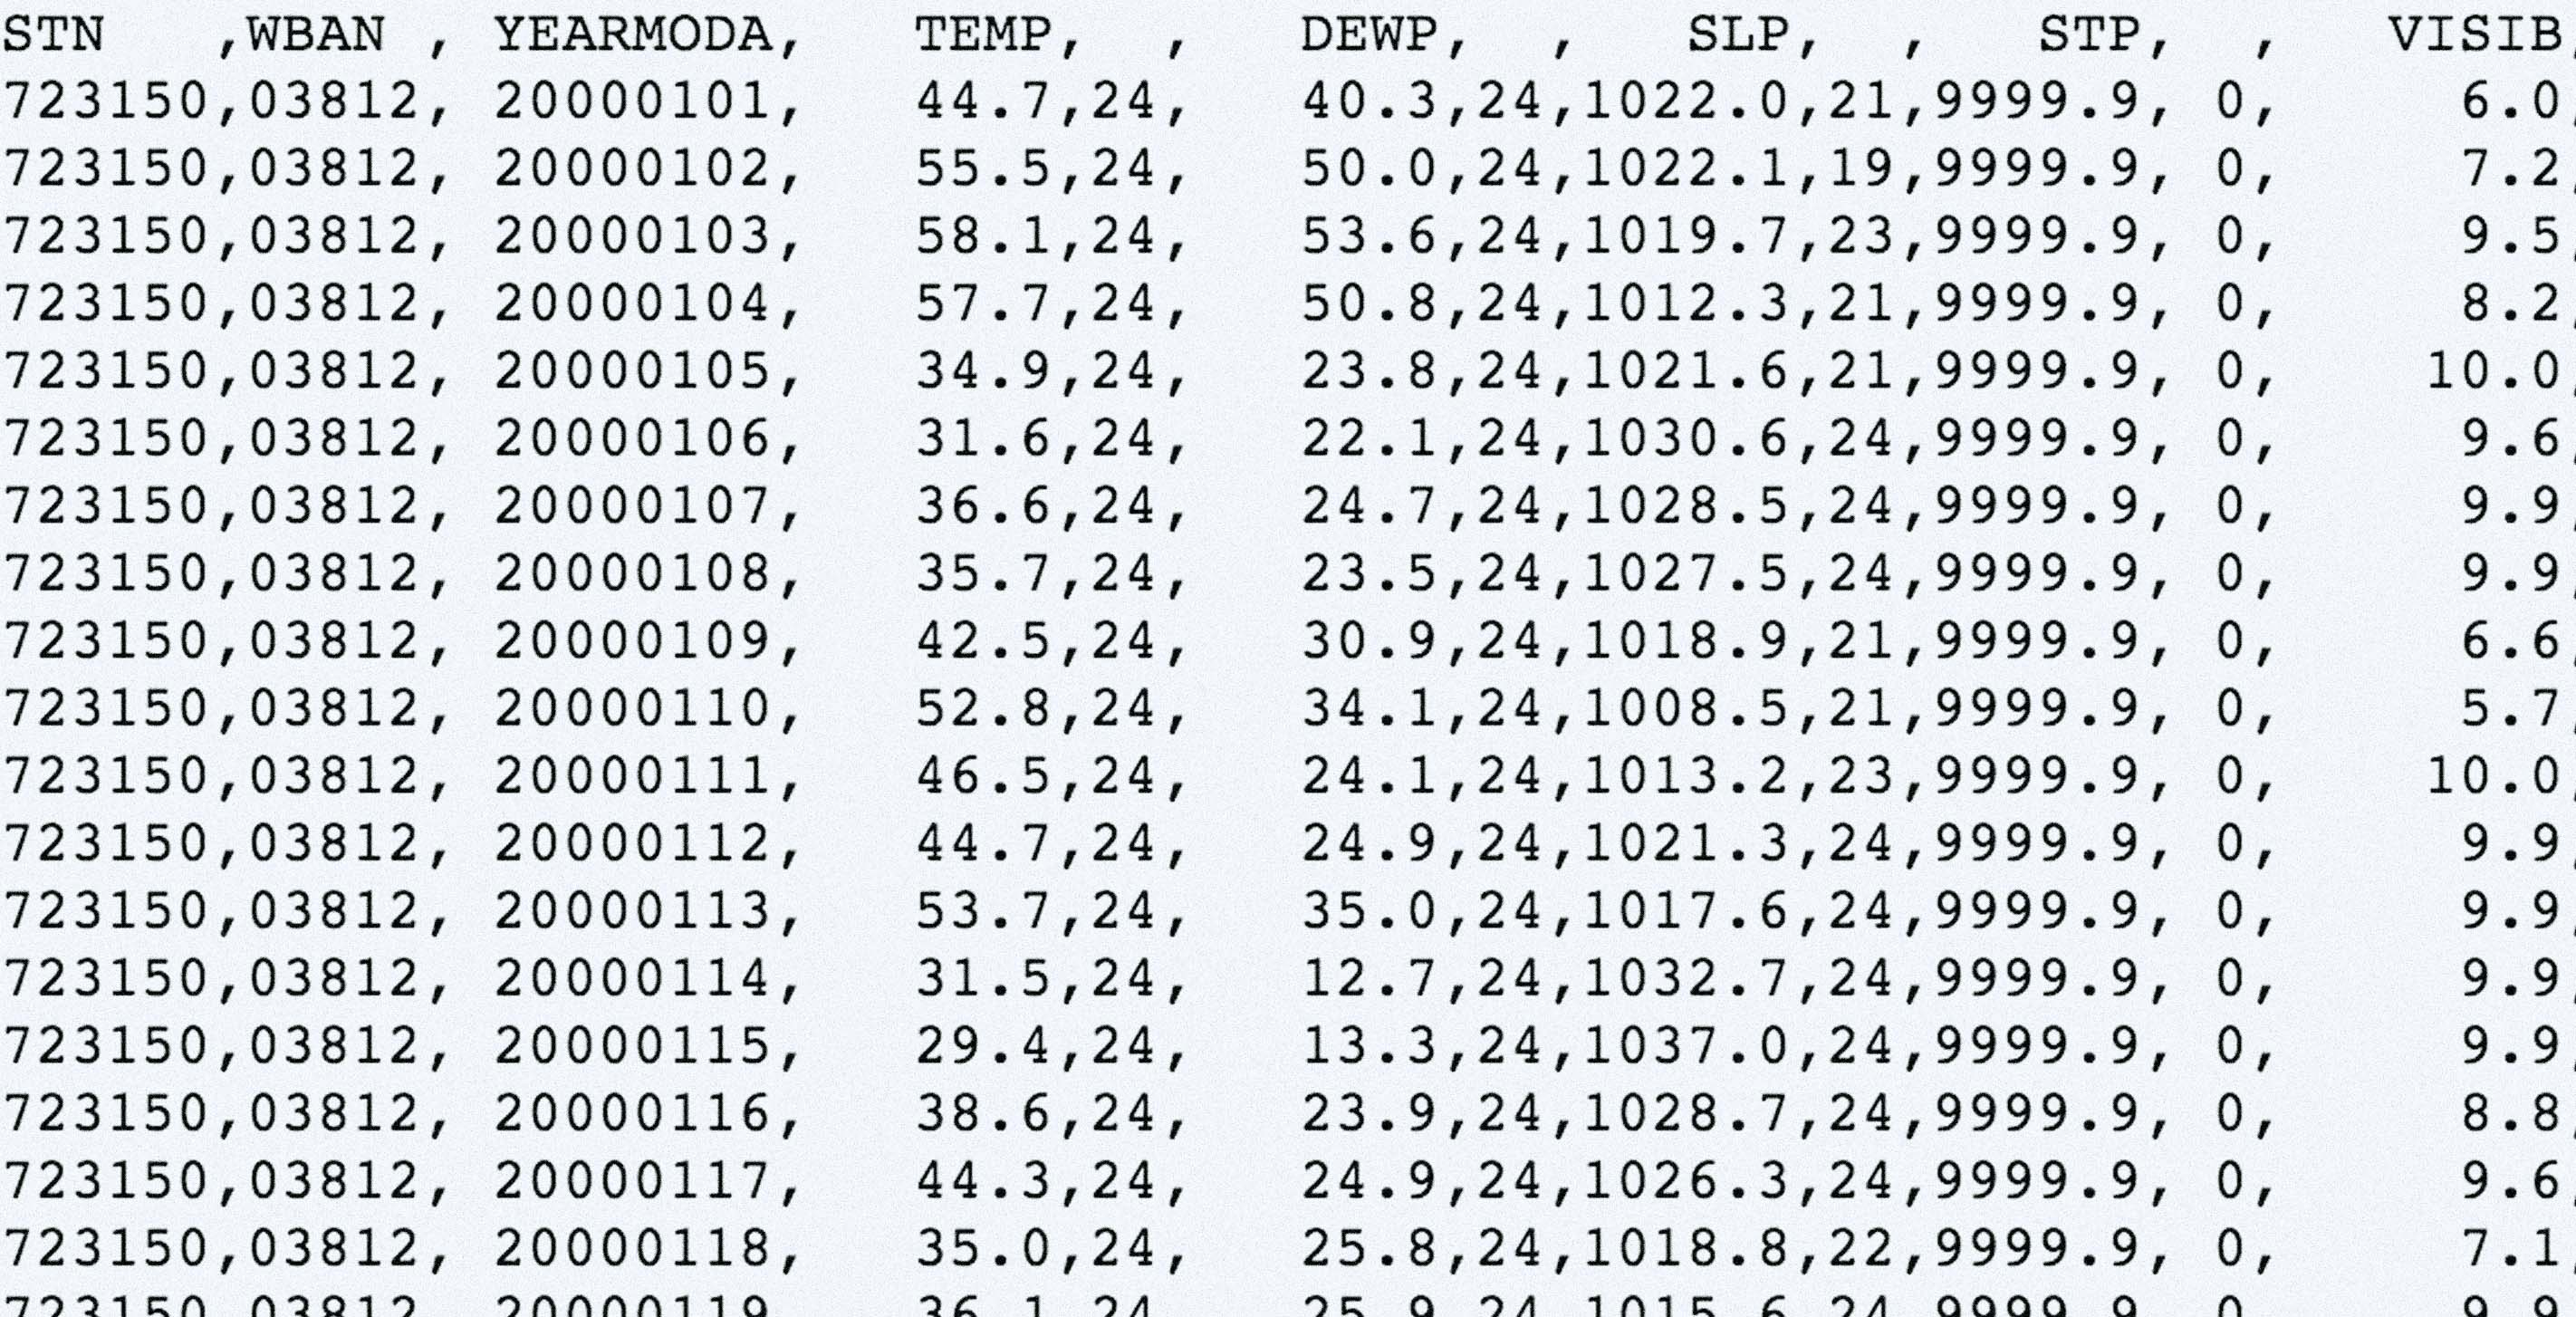
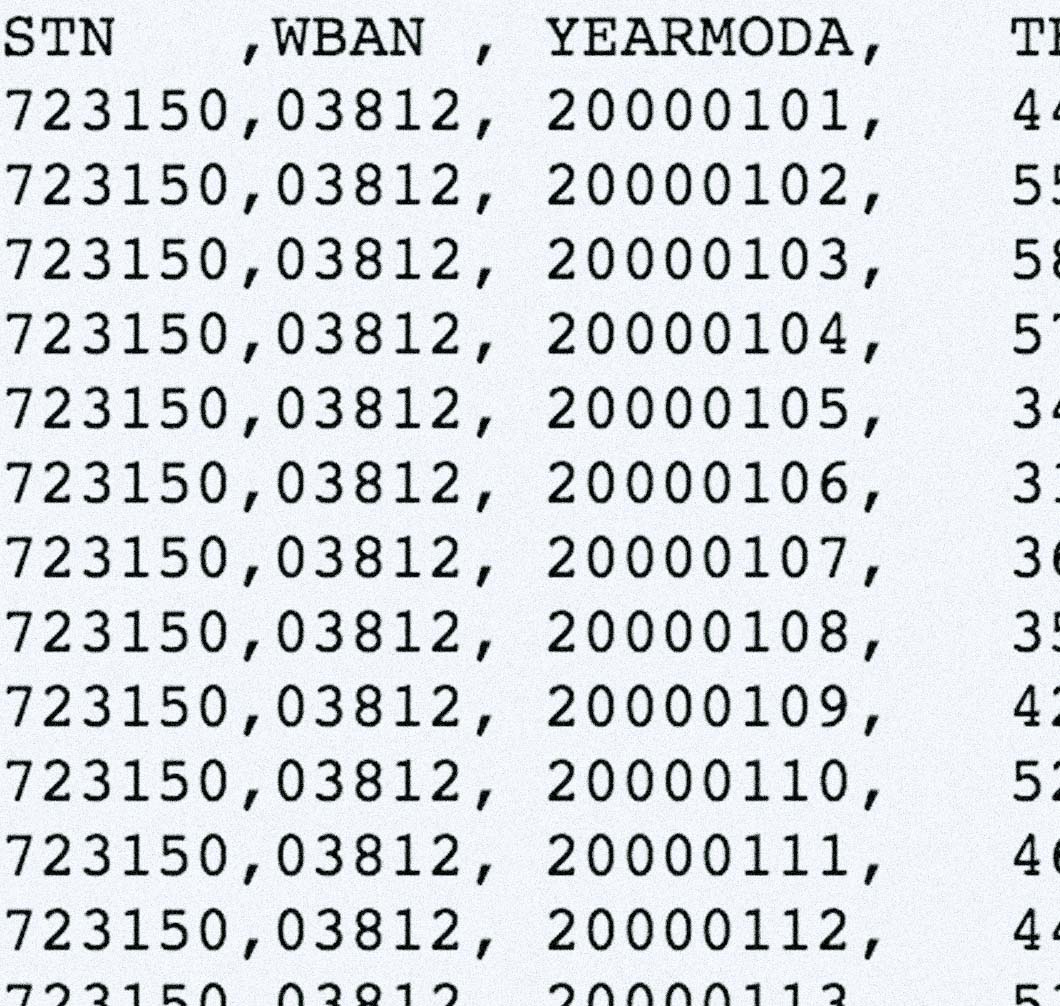
- Methodology: Historical weather data pulled from the US National Oceanic and Atmospheric Administration 's National Climatic Data Center Global Summary of the Day. We pulled data from 1980 to 2011, and for each weather station represented, we excluded a year's worth of data if it had less than 20% of the year represented. We also required at least one reading in every winter month for each year. After that, we only included stations that had sufficient annual data for at least 6 years. This brought it down to 8229 weather stations worldwide. The 1990 map was based on many more stations (8k+ in North America Alone).
- The USDA 1990 Map.
- Wikipedia explains hardiness zones quite nicely.
- The methodology of the 1990 map
- Here's a shout out to the at generously shared geo javascript libs by Movable Type Ltd., UK.