
Welcome to Fathom’s second episode of Especially Big Data — a show where we explore the many subjects data can document, while also shedding light on its many limitations. I’m Alex Geller, and today we’ll dive into the complications of data collection — why we do it, how we do it, and how far we go to get a single data point.
But before we explore the many places we go, I want to remind you of a simple concept that we often forget when discussing all the “big data” everyone has these days. For now, let’s call it the history book conundrum:
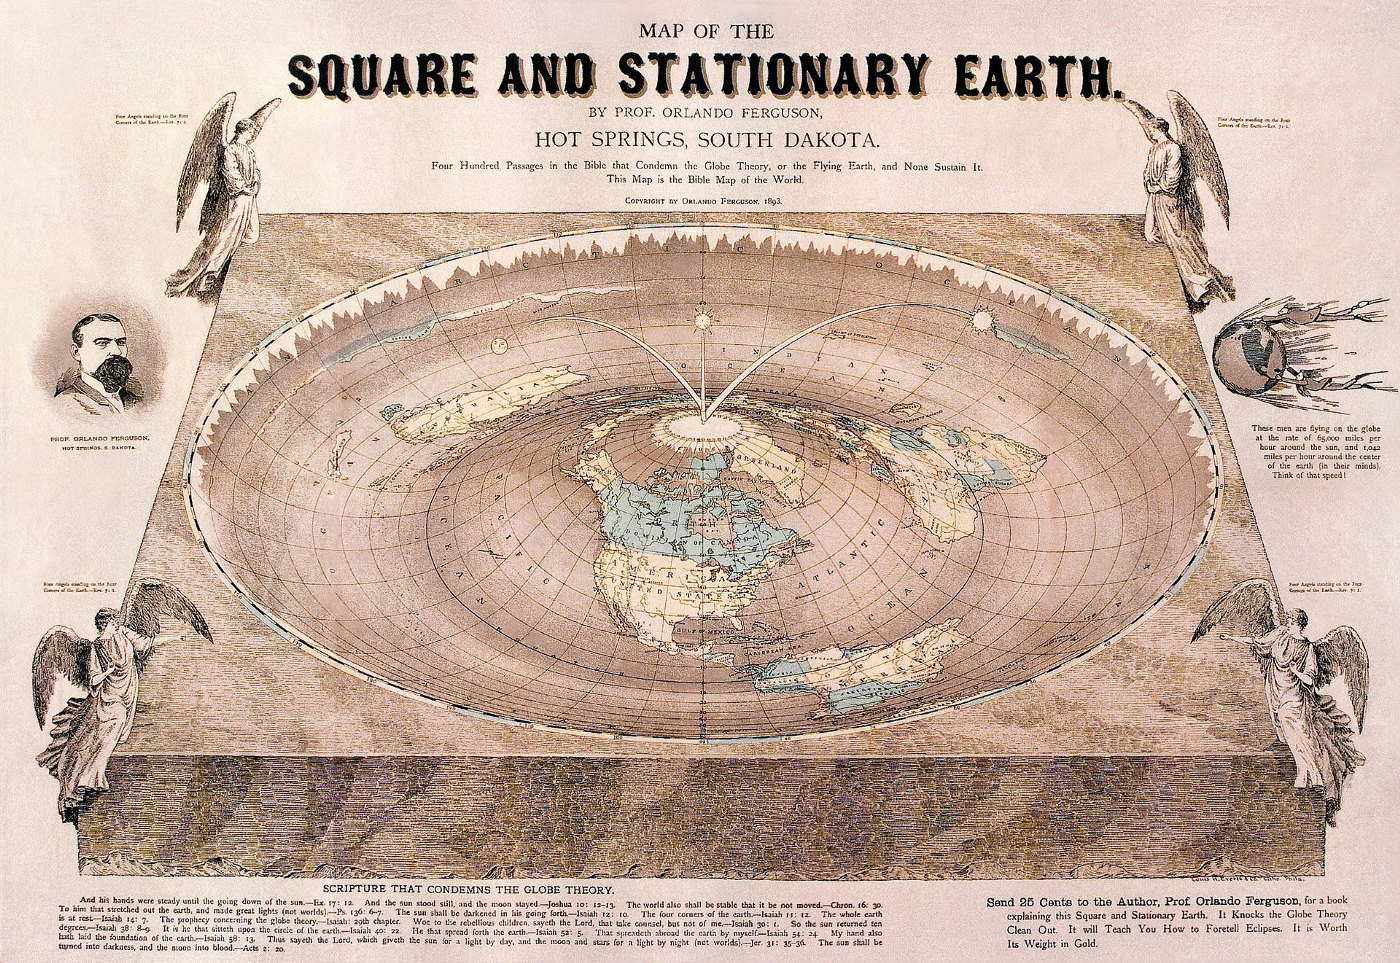
We regard the contents of a history textbook as a recollection of events that occurred in the past, but how often do people remember to ask who wrote the book? And who were they writing it for? History can be written in so many different ways — through street names, monuments, the media, textbooks, the list goes on. Along with that documentation, the author makes a very real decision to include or exclude information. And whether conscious of it or not, bias is inevitable. In the case of information design, the data collectors, analysts, developers, and designers have a very real power to determine how the rest of us understand “the truth.”
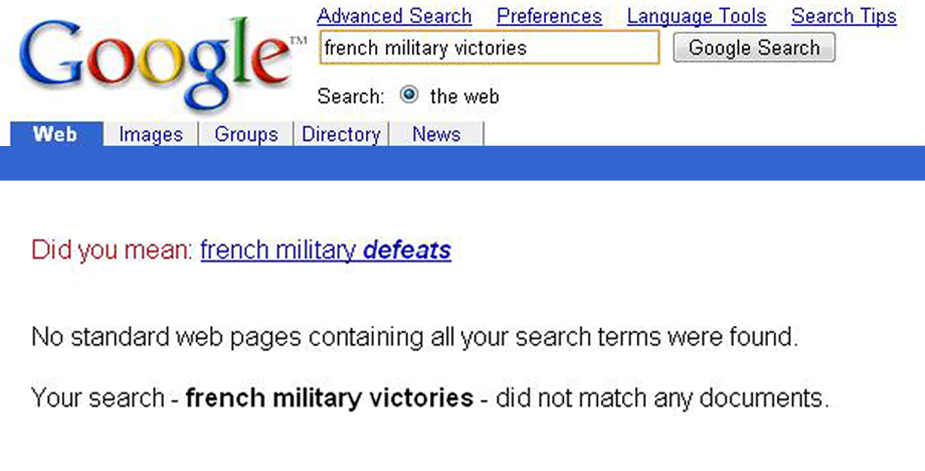
There are so many people turning to data to explain the world around us, that we often don’t consider the authorship behind the information. And when data comes from a place that we see as a reputable source, we’re even more likely to take it as fact.
Now, I’m not trying to undermine the power of data here, but rather remind you of the many hands it passes through before it finally reaches your attention. Who collected the data, how were the questions framed, what population was surveyed? And then there’s the presentation of the information — who made the charts, who determined what axis would be used, or which countries would be featured, or what form the data would take. Someone — or often many someones — make a series of decisions about which information will be communicated, and how it will be conveyed to the general public.
To better understand how many degrees of separation there are between the audience, the authors, and the cold hard numbers, we’ll take this opportunity to dive head first into the data collection process. From the door-to-door surveys of the U.S. census, to the mountain-to-mountain process for community health workers, and then to a NASA satellite hovering more than 600 kilometers above the earth — I’m excited to share with you just how far we go to collect a single data point.
My name is Steve Klement, I am the chief of the Quality Programs Staff here at the Census Bureau, and essentially my job is I am the keeper of the bureau’s statistical quality standards.
Steve ensures that the bureau’s surveys follow their quality standards at every step — from acquiring and collecting data, to producing estimates, to editing and analysis, and then to the final release — he makes sure the public sees the most accurate information possible. In their own words, the Census Bureau strives to serve as the leading source of quality data about the nation’s people and economy, and it’s clear that every step of their meticulous process supports that mission. The Census needs to preserve the integrity of their collection and communication efforts — because ultimately the population they survey, is also the population they serve.
It’s a transparent process, so the public knows what it is that we do to ensure that the estimates we give are as accurate as possible.
In addition to the decennial census, the Bureau also conducts more than 130 surveys each year to gather information on the nation’s people and economy. They conduct focused studies on topics like public libraries, medical expenditures, identity theft, and the like. And there are a series of issues that come up at each stage of their collection process, for any survey. One of the most common issues is actually when people don’t respond at all.
We basically rely on the goodwill of the public and the good name the census bureau has with the public for our responses. The main overall factor that affects response rates is how much the respondent trusts the person that they’re talking to. And right now the Census Bureau still enjoys a very good reputation with the public at large even though a lot of folks in the media reported how government in general is not trusted.
And for the record, trust isn’t the only factor influencing response rates. Sometimes, people are just generally difficult to reach.
If someone doesn’t respond then you don’t know what you don’t know about someone. But what I can answer is that what we try to do to contact those that are harder to find — we’ll use what are called multi mode surveys, which is a combination of mail, enumerator, phone.
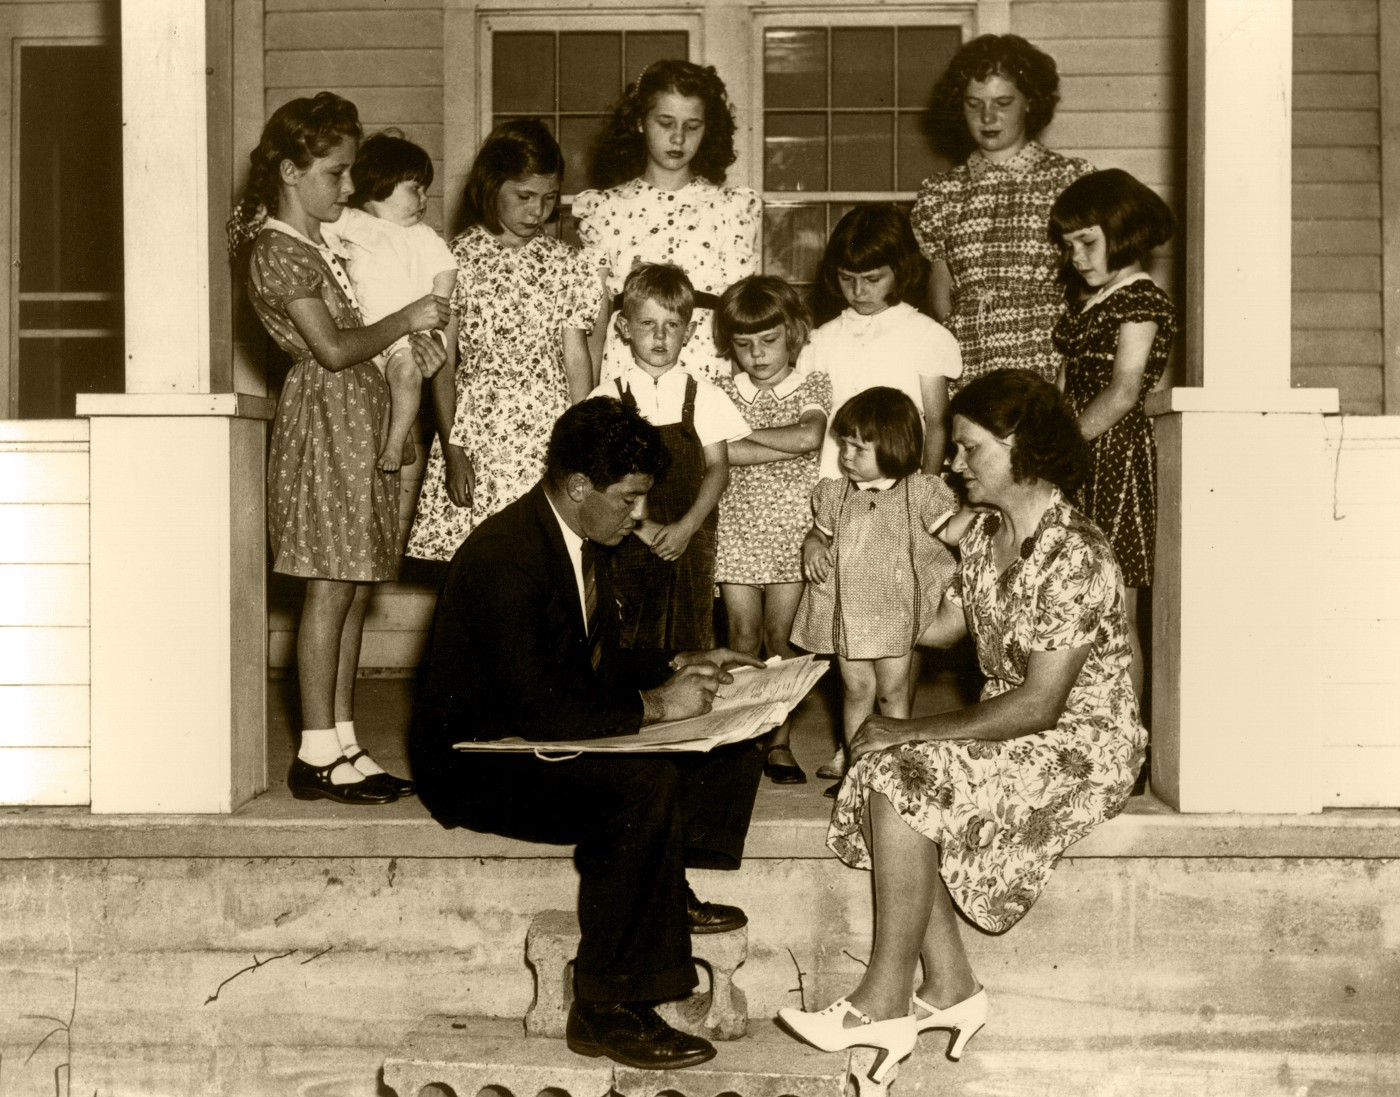
To clarify, enumerators are the people who go from door-to-door to catch respondents at home.
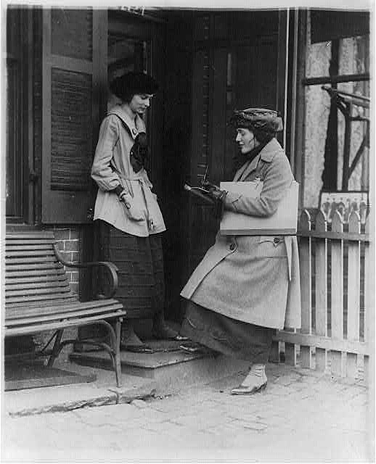
Some people may be harder to reach at their phones because they work two jobs, but when the enumerator comes by they’ll speak with a neighbor and find out when the person normally is home and then come at that time. Also the phone-based contact attempts are done at various times of the day to maximize the chance of reaching someone.
The census is making incredibly targeted approaches to gathering information on any single individual or business. And as far as the population without a phone or permanent residence, like the homeless for example, well, there are methods for that too.
In 2010 the bureau spent three days counting people experiencing some form of homelessness. Surveyors systematically documented people using shelters, soup kitchens, food vans, and those who slept outdoors or in automobiles — and this effort occurred in every county of the U.S. The operation counted 209 thousand people living in emergency or transitional shelters. And to be clear, the three days weren’t intended get an overall count of homelessness — but rather to include those who might otherwise go under the radar.
It’s our onus by the constitution to try and count everyone living within the borders of the U.S., and therefore we do count the homeless population.
When the census is missing a portion of the population in their surveys, they make sure they are fully aware of the resulting information bias. Now, when I say bias here, I mean that in any given survey, some groups are either over or under represented in the overall sample of respondents — so the final results don’t really show the actual breakdown of the full population. As a result, we might have a more accurate picture of some demographic groups over others.

To give you an example, let’s pretend we’re measuring the number of animals in a pet shop by how much noise they make. We’d probably assume there are a lot of dogs, a few cats, a few really loud parrots, and absolutely no goldfish. Based off of our methods, our survey would have a bias that favors the louder animals, like the dogs, and probably the parrots, too. And without any correction efforts in place, we might miss the portion of the population that’s more quiet — which are the goldfish in our case, or the non-responders for the census. It’s not that the goldfish don’t exist, but rather that we can’t see them when using our current method. If the bureau notices anything odd with response rates, they can cross-check information from years past, or focus their efforts with the phone or door-to-door approaches.
There can be things such as sampling error, where if your target population is the U.S. but you’re going to conduct your survey by phone only, well by definition you’re not going to cover anyone in the population who does not have a phone.
So just as we would be misguided to measure animals in the pet shop by their sound, the census can’ t rely solely on phones to get a diverse group of respondents. By mixing up their approach, they also get more varied participants. In short, the Bureau puts a lot of effort into gathering information from an accurate sampling people of different ages, racial groups, education levels, and geographic areas.
But issues can also arise when there’s a miscommunication between the surveyor and the respondent.
When you ask the income question, and you ask how much somebody earns, one person might take it ok that’s my salary; I have a job, I get paid this much. If you ask me personally what my income is, I would think ok my income is my income, my wife’s income, my income from my investments, and add all that together. So how do you ask the question to ensure you get what you wanted?
The census has fine-tuned their questions, and surveyors go through extensive training to minimize any misunderstandings between the person asking and the person answering a question. Their surveys are also available in six languages to reduce translation barriers. But still, there are cases where respondents answer questions incorrectly. Let’s take the reporting of business revenues, for instance:
So we’ll have a small business in a rural area that has revenue that is more than the entire town, we have an editing system that will catch those and flag them, and an analyst will try to determine what the cause is for such an outlier.
We’ll look at the answers of the respondents, and we’ll see if they’re in the ballpark of what we’d expect them to be. For instance if you ask a doctor his salary, and his answer is 500 million dollars, that would raise a red flag that we need to research if it’s accurate.
The Census can fact check their data with the IRS, the Social Security Registry, and other organizations so they can verify the information they receive. And while they go to great lengths to ensure their data is accurate, there are also cases when the Census intentionally hides, or suppresses information to protect businesses and individuals. Employees are even required to take an oath that they won’t divulge any private information.
It surprised me a little bit on my first day here. I’m a former army guy and you know, I had to swear allegiance to the constitution when I joined the army, and when I came here I raised my right hand to swear I would protect the country’s information.
When you release a table of information, if you’re not careful, there are sometimes ways to back out individual responses.
When Steve says “back out responses,” he means that it’s possible to deduce private information based off of general survey results.
And that is something we try very much to avoid. It’s called disclosure avoidance. So for instance, if we released information of the computer software industry in the city of Redmond, Washington, the 800 pound gorilla in the room would be Microsoft. And therefore, if we released that number, we’d essentially be giving their answers. And that’s something we’re sworn not to do. So instead, that individual piece of information, we wouldn’t release, because we’re not going to tell people private information both on businesses and on people.
So how does the census determine the threshold of whether information can be released or not? Well, again, in terms of privacy, they can’t disclose those limits because the public would be able to determine revenues or wages for certain companies based off that information. And this tendency to lean away from disclosing potentially private or inaccurate data — this is a standard for the entire Census. Steve said the bureau would sooner keep information private than release any values they can’t stand behind fully.
Their data verification procedure is extensive. It entails supervisor reviews, edits, imputations, analysis, and they always make a point of publicly releasing the margins of error for each data point. In short, the Bureau wants to make sure people don’t make decisions based on their data, without knowing the extent of its accuracy.
It’s not the case where every single cell of information is looked at, because we reveal literally millions upon millions of estimates each year. But what we have are computer programs that will look for this automatically, and whenever the program has a flag as we call at it, then an analyst looks at it and we say ok, why did this get flagged, what’s the issue, and do we need to take some sort of preventative measures to ensure we don’t release either erroneous data, or data that might compromise someone’s privacy.
Surveyors need to be mindful of the privacy and sensitivity of information. For the census, that awareness comes into play with the release of data, but a lot of consideration goes into the collection process, too. The mental or physical state of participants, cultural contexts at play, or the environment in which questions are asked can all impact responses.
At the same time, surveyors need to be sensitive to the people answering their questions. Pushing someone to respond against his or her will is just not really considered best practice. Let’s say we were gathering health data, for instance, and we were asking mothers that recently gave birth about their contraceptive methods.
It was interesting, this was actually a huge conversation in Sri Lanka versus other countries. We have to ask the women if it’s ok and then we can interview her; and if she says no its completely fine. This is not health care we’re providing, this is data collection, and it’s completely ok if she doesn’t want to be talked to.

That was Meryn Robinson, a senior research coordinator and field manager at Dimagi, which is an enterprise that develops software to improve service deliveries in underserved communities. In this case, that service is data collection. She’s travelled to Sri Lanka, Tanzania, and Kenya to train community health workers how to use mobile and tablet applications to gather health data. One of her projects focused on how family planning can increase mothers’ awareness and use of contraceptive methods, in places where they might have less access or familiarity to healthcare options.
And so the point of the data collection was to see if the counseling was helping change the rates of uptake of post-partum IUDs at these places. So they had an interesting job in that they would go in and the first time they would talk to a woman was right after she gave birth, within the first two days, which is a pretty stressful time for a lot of moms, so there was a lot of context that they had to learn about going up to women and how to conduct themselves in a respectful way, because that’s a time when you’d want to be really sensitive to what the woman would need.
As you can imagine, collecting information from a mother who has given birth within two days can be a delicate situation. Especially when she might be in a maternity ward, where it’s one long room of, say, twenty beds. If the questions are sensitive, a new mother might not necessarily want to speak in a setting where she could be overheard.
They were collecting a lot of demographic information to see how that all kind of affected the uptake and one of them was an income question and they told us that no person is ever going to want to answer this question.
This data collection was happening right after a woman gave birth so she’s in a hospital, she’s probably surrounded by family members, might not want to talk about income in front of her 50 aunts and uncles who are all hanging out.
Dimagi was founded out of the MIT Media Lab in 2002, and today it has offices all over the world — from Cambridge, Massachusetts to New Delhi, Dakar, and Cape Town, among other places, and their main software is a product called CommCare, which is a mobile solution for data collection in low-resource settings.
When I say low-resource, I mean areas where Wi-Fi, or electricity are hard to come by, maybe transportation to or within the location is difficult because there aren’t many paved roads. These are areas where data collectors may not have the luxury of calling people on their phone, because most households may not have one in the first place
One of the big selling points for CommCare is that it works offline, so you can download it onto your tablet. And it doesn’t need to be connected, you can collect data and then sync once a day and it’s all sent to the server.
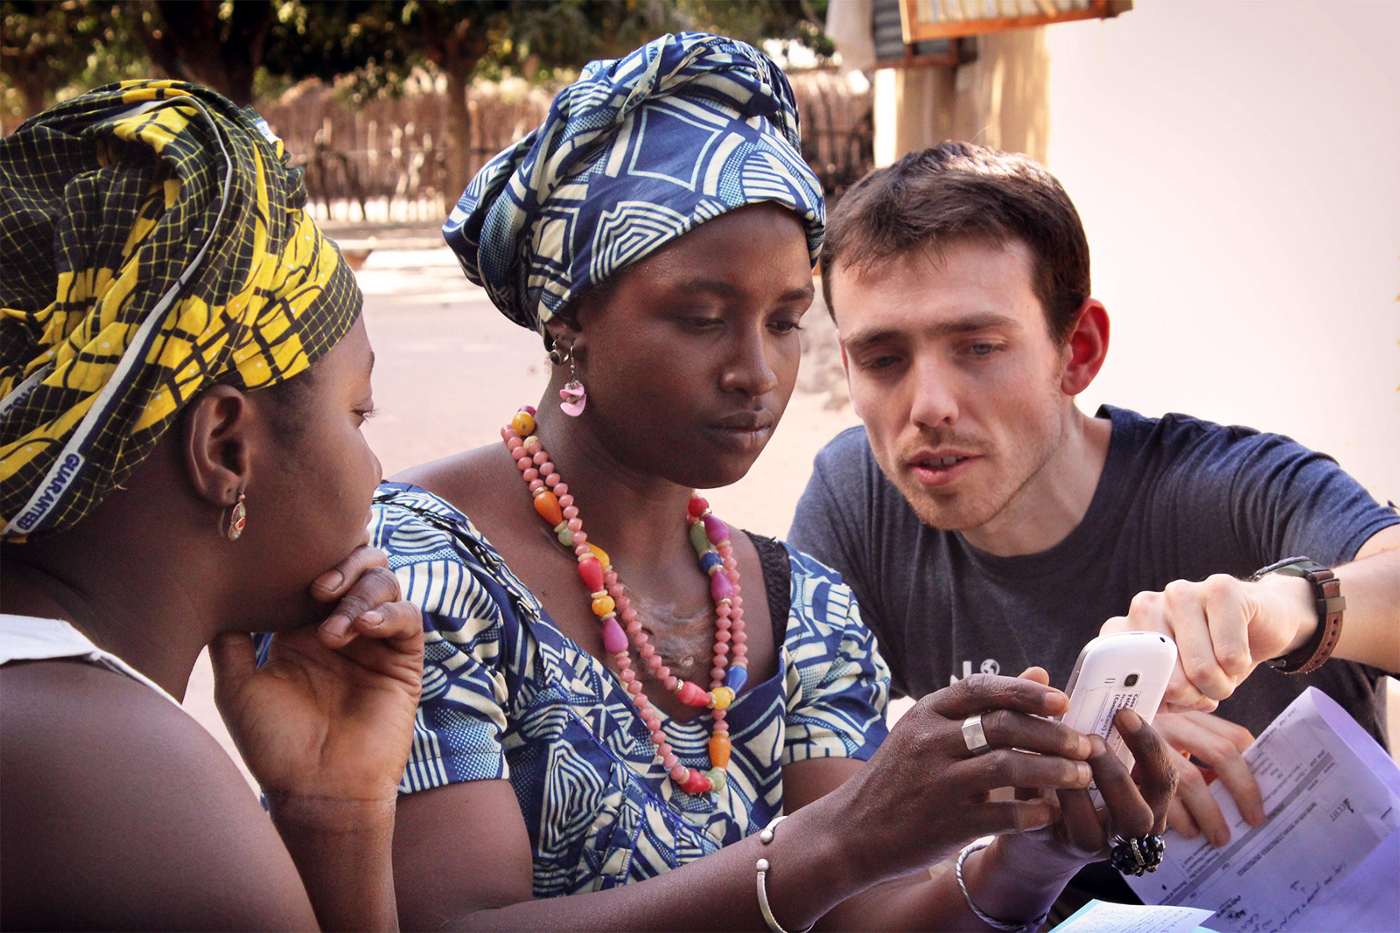
Mobile-health, or m-health as those in the field call it, is a term used for the practice of medicine and health services through mobile devices — usually through cell phones or tablets. In low resource areas, community health workers can use cell phones to diagnose, monitor, and communicate with patients.
Imagine how much easier it is for data clerks to travel, let’s say, from village to village with a single phone as opposed to carrying a large heavy ledger — where they’re calculating and transferring information by hand. M-health can be really effective in areas where health clinics and hospitals are sparse, or difficult for patients to access. I almost want to compare it to a food truck, only it’s for your health.
Dimagi tends to follow where their staff travels to a specific location to train data clerks how to use their software. Those health workers can be based in a single location or health clinic where patients come to them, or — in especially rural places — they may travel from home to home.
Sometimes they do have to pretty much go to the edges of the earth to try and find these places.
This guy was kind of straddling between a health project and supply logistics, and so he was following these guys with these trucks around that were delivering supplies. They had this great photo montage of literally cars half-buried in mud, and people trying to pull them out Aund when there’s not a bridge you build one! So there were all these precariously perched branches across this raging river, and they needed to get across.
Sometimes it is like that, but in other times in the post part of my IUD project is a great example, but you’re based in a central clinic. So you’re just in one central place and you’re letting people come to you and you’re catching them as they come through.
Meryn had this really great story about a co-worker who was training health workers in Guatemala. She had to take a four hour hike each morning just to get to their village. And after that, sometimes she would have to walk an additional two to three hours just to get from one home to the next.
There was a community of people that lived over this 2.5 kilometer peak. And they live there so they don’t have to travel a lot either way, but to get to the training, they [the community health workers] had to go on this crazy path that went a 45 degree angle up and a 45 degree angle down (laugh). But yeah for us it’s like I walk ten minutes to my office in Cambridge while my coworker walked up a mountain to get to her office.
Part of what’s so unique about Dimagi is that they tailor their tools to the population who will be using them.
We call it design under the mango tree, and that essentially means that when we try to put together anything, we want to try to cater to the people that are using it, because that’s one of the more impactful ways to make sure it is used and that it’ s easy to use — because those are two big barriers. But that’s really hard because often times the people that are paying us and trying to put the apps together are not necessarily the people who are using it.
And this is a really important thing to note. Those who are designing the study or building the study, are not the people who are carrying it out in practice, so you can imagine the amount of disconnect that could take place. For all the training the Dimagi team does with community health workers, the whole teacher to student relationship really goes both ways. The team developing the applications really relies on the health workers to voice which terminology is most appropriate, or to point out cultural sensitivities.
They had questionnaires that the client wanted to use, and the client was the one paying us, and they were great and they were trying really hard to cater everything to each specific country, which is a big job when you have the same questionnaire being used in six countries.
There were a lot of nit picky details like “oh we don’t call that an admission card at our hospitals, it’s a mother’s pregnancy card.” You kind of have to go in knowing “I have this app, were going to train on it, and after the training is over I’m going to have really great feedback and I’m probably going to have to adjust a few things to make sure it caters to this group of people that wan’t to use it.”
The team developing the software has a lot of back and forth with community health workers and data clerks to understand the changes for the survey’s workflow. Both sides work together to make sure the tool is as intuitive, culturally sensitive, and as geographically relevant as possible. In addition, a series of checks and balances can be programmed into the backend of the software to help ensure its accuracy.
We can do a lot to help minimize data entry error, but it’s not going to fix all the problems. So we can do calculations on the app instead of having people do hand calculations, and we can do validation for entries so if you say “what is your age,” we make it impossible to type in 150 for example. But there’s not a lot we can do if someone mis-types their birthday.
We also have worker reports that you can use to look at things like how many forms are being submitted, how many cases are being opened and things like that. And so just identifying outliers within those trends, if you see one person is only submitting a form a day when everyone else working on that project is submitting 30 forms a day, it’s like ok — that might be something we ask them about.
Having access to the metadata allows supervisory teams to check the accuracy of their information. And for all practical purposes, mobile health solutions really are a more efficient use of time and money, and also enable local job development. At the same time, it’s important to understand its limitations. Survey data can tell us so much, but it can also measures issues in isolation.
The fundamental idea is like how do we come up with an actual metric that’s measurable and then can indicate to us it’s a successful project, which is an incredibly difficult question to answer because how do you even know if the thing you come up with is the right thing to measure.
There was this really great example of this huge donor and they were doing this education project, and they were trying to figure out what measures they could use from the data they were collecting to measure the impact. But their definition was — if you got a package of school supplies, you were educated. It just struck me as really, almost unbelievable, that this much money would be going into stuff and we would have no idea if it would actually work or if it did work.
The question is how do we find the right measure for impact here. Would assessing school enrollment have been a better indicator? Or maybe graduation rates? t can be difficult to find a variable that fully captures the information you’re looking for. Because while data can point us to the occurrence or prevalence of a lot of issues, we need to consider metrics within their greater, more complicated systems.
I think the data collection can only get you so far, and it is good for exposing these gaps. But the question is, now that you know about it, what can you do? And that’s a question public health people pose all the time.
We can tell this gap does exist and we’re starting to see it, but it’s in an entire system that has a lot of other problems that need to be addressed.
If you haven’t caught on already — I’m sort of hooked on this notion that data can serve as a really wonderful and informative window. It opens our eyes to these large intricate systems, but we can really only understand those systems to the extent that our data, or that window frame, allows.
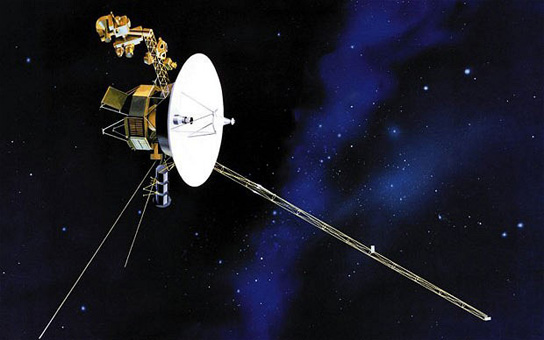
One organization that’s done a phenomenal job of expanding their lens of information is NASA. And to widen the extent of data they can observe, they’ve taken their collection process more than 600 kilometers above the earth.
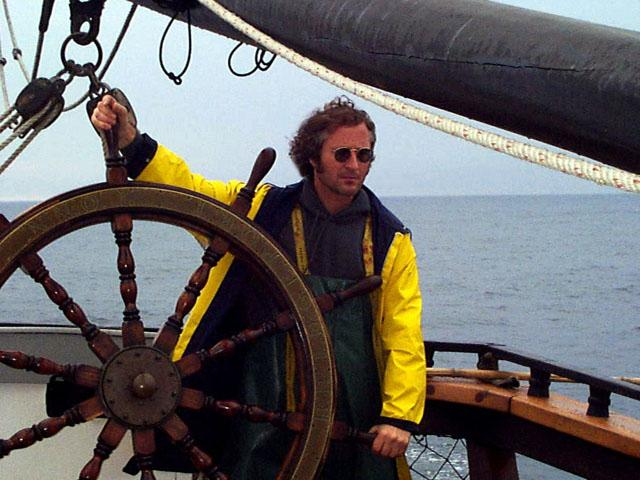
My name is Gene Feldman I am an oceanographer at NASA Goddard Space Flight Center, and I observe the ocean from space.
That’s a fairly laborious process, and I’ve done it, and when you think you want to do this stuff on the deck of a heaving ship in the middle of a storm, it’s not that much fun. Plus, the ocean is very very big, it covers three quarters of the earth’s surface, and it changes very rapidly. So trying to get a really good picture of the ocean and how it changes over time and space from the deck of a ship is a very difficult thing to do.
Back in the 60s and 70s, it was believed that we could start observing the earth from space. And through satellites, well…
If they’re in the right orbit, they can see every spot on the earth every single day. We call that a synoptic sample, which means seeing a large area in a single look. And that’s really what we need to do to understand how the earth works and how all the various physical, chemical, and biological systems interact.
So it’s not that the system of taking a boat out to sea to study the ocean is outdated — not at all. But for oceanographers like Gene, who are trying to get a holistic view of the ocean, satellites are much more efficient. One of the satellites he uses can collect about one million square kilometers worth of information a minute — with each observation being one kilometer square.
If I were sitting in a ship — and I’ve done this — and I’m traveling back and forth at about ten kilometers an hour, and I take a sample every kilometer, it will take me a decade to get the same density of sampling that the satellite took in one minute.
At the same time, scientists cross-reference a good portion of the satellite data with water samples taken by boat. And through that system, they’re able to create predictive models that estimate key measurements about the ocean as a whole. So, which characteristics of the ocean can we measure from space? Why don’t we dive into a more tangible example, like ocean color. Here’s Gene:
Just like when you go to a doctor for an annual physical, there are certain key things that a doctor measures. The doctor measures your blood pressure, heart rate, pulse, those kinds of things. These are your key vital signs. So there are a number of key vitals signs of the ocean, that scientists have determined — if we measure them over time, they’ll tell us about the health of the ocean, and how those are changing both in time and space. And then more importantly, what may be the processes that are causing that change.
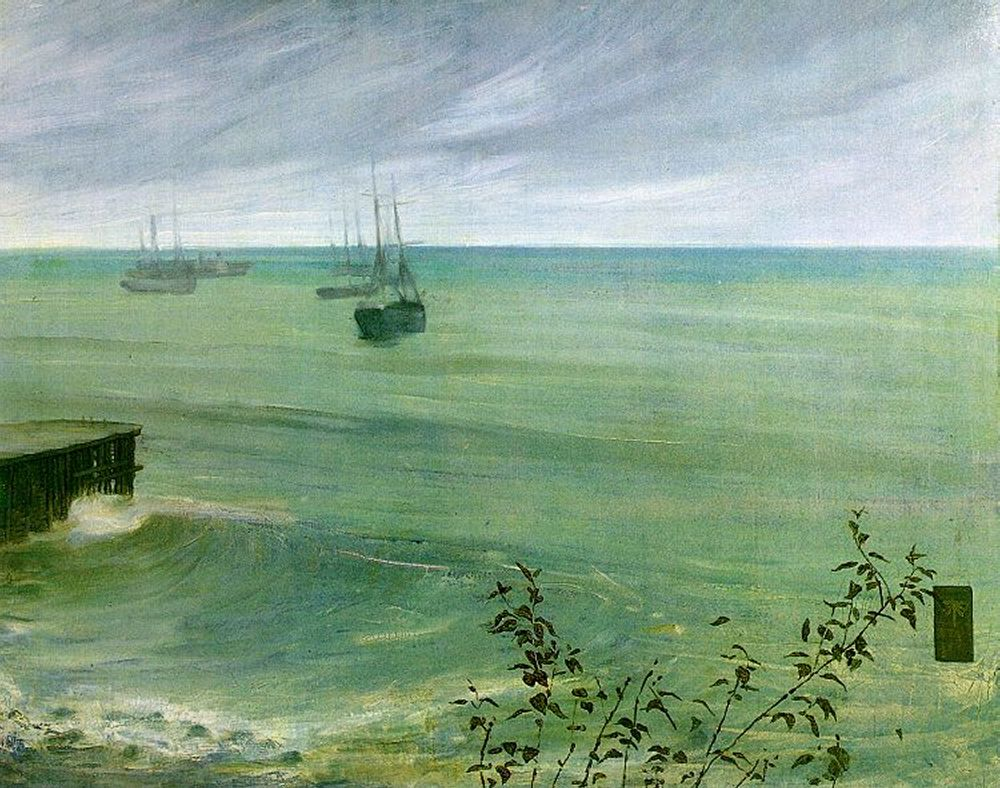
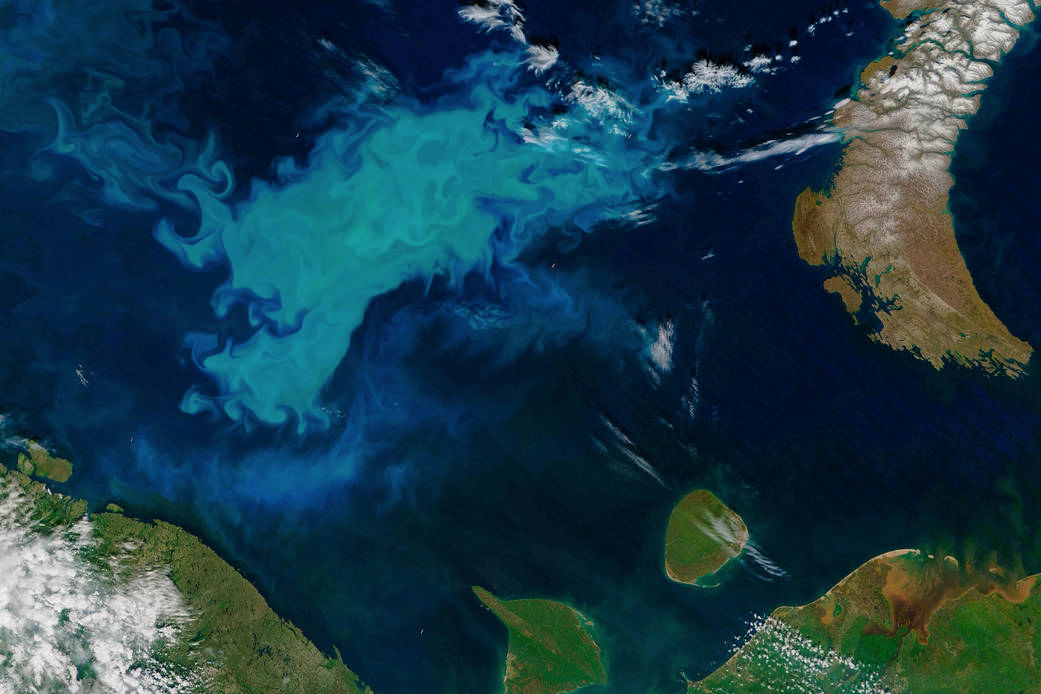
So some of the things we measure are sea surface temperature, salinity, and for me, in particular, because I’m a biologist, I’m interested in the color of the ocean. Most people think the ocean is just blue, but in fact it is many many shades, and a lot of that is determined by what microscopic plant life exists in the surface waters. These plants called phytoplankton, have chlorophyll, which is a green molecule that plants on land have that absorbs sunlight and converts carbon dioxide and water into oxygen and plant tissue. Most people don’t know it, but half of the oxygen that we breathe comes from microscopic plants in the ocean.

Because of the chlorophyll — or that green color pigment — as phytoplankton bloom and grow, the ocean gets greener. In parts of the ocean where phytoplankton are scarce, the ocean is bluer. So while we may not be able to see the single organism with our naked eye, when they live in high concentrations, we can detect them all the way from space — simply by measuring the color of the ocean.
Because of the chlorophyll — or that green color pigment — as phytoplankton bloom and grow, the ocean gets greener. In parts of the ocean where phytoplankton are scarce, the ocean is bluer. So while we may not be able to see the single organism with our naked eye, when they live in high concentrations, we can detect them all the way from space — simply by measuring the color of the ocean.
About 40 years ago, NASA launched its first experimental satellite to see if it was even possible to measure the color of the ocean from space. They compared the satellite’s measures with those taken from ships at specific times and locations.
And low and behold, it worked!
NASA could relate the prevalence of chlorophyll, or phytoplankton in the water to the overall greenness in different parts of the ocean.
The reason I think ocean color is important and something that people really need to understand is that the oceans are changing. That’s a given. And the change in the physical properties in the ocean, the change in the chemical properties of the ocean, will have an affect on the biology of the ocean.
Not only does it affect where the fish are, or how many fish there are, but it also affects the foundation. The phytoplankton — like the grass on the plains that feed all the other creatures. Phytoplankton in the ocean form the base of the marine food web and all life in the ocean, they play a very important role in how much C02 is in the atmosphere and I’ll go out on a limb here and pretty much say life on earth would not exist if it weren’t for phytoplankton in the ocean.
As we discussed earlier, getting the right metric for impact can be really difficult. So when Gene tells me that measuring ocean color is a vital sign of the ocean’s health, it’s pretty incredible to think that color is actually an indication of the livelihood of these microscopic organisms. And these organisms are responsible for the health of our oceans, and really the health of our planet. And the real kicker is that we can recognize these tiny organisms from a satellite orbiting more than 600 kilometers above the earth.
So how does this process actually work? It requires multiple steps, and to be clear, NASA isn’t measuring the amount of phytoplankton in the water. They’re measuring how much light, or how much radiance rather, the satellite perceives to be reflecting off the ocean.
Let’s assume that the light coming down from the sun, that’s 100% of the signal and that’s all we have to work with. A lot of stuff can happen to that light as it travels through the atmosphere. It can bounce off of clouds, but the atmosphere is not transparent. There are things in the atmosphere. There’s water vapor, aerosols, dust, there’s smog, there’s all sorts of stuff in the atmosphere that the light interacts with.
When we’re looking at the color of the ocean we’re relying on visible light. So just think about it, if you’re flying in an airplane and you look down, if there are clouds between you and the ground, you don’t see anything. It’s the same problem with satellites. If we’re looking in the visible part of the spectrum, the only time we can actually see what we’re looking for is when there aren’t any clouds. And the world is a pretty cloudy place.
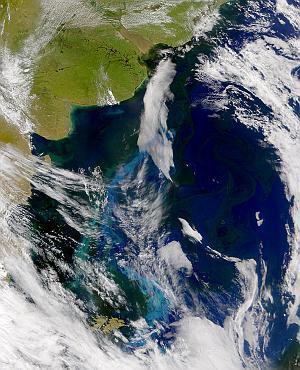
The satellite collects daily observations, where half or more of the image of the world is covered in clouds. As the scientists average information over time, by two days, three days, four days, a week, maybe a month, eventually they’re able to gather a global picture of ocean color that sees around the weather. They can basically average the information from the days when conditions are clear.
For those of you who also forgot high school physics, light can be absorbed, reflected, or refracted. The light that NASA scientists measure from their satellites is that small portion of light that bounces back, or that’s reflected, from the ocean.So now you’ve got the sunlight coming down through the atmosphere, it then hits the ocean surface. Some of that light interacts with things in the water, which would also change the color of it. So if you have a lot of phytoplankton in the water, they will selectively absorb a lot of the blue light and reflect the green light. That’s why things look green. That’s the light that bounces back at your eyes.
Now that light, for us to be able to use it in remote sensing, has to make it all the way back up through the atmosphere that’s filled with all kinds of junk, 650 kilometers back up to a spacecraft where we see that light. So it’s amazing that any of it gets back. So the light that the satellite is seeing, let’s call that 100 percent, 90 percent of that signal is due to scattering in the atmosphere. The reality is the signal that comes out of the ocean that we use to make our measurements in ocean color is only about ten percent of the entire signal that the satellite sees.
So that’s step one of the process: measuring and verifying the brightness of locations on the earth from the satellite. By looking at locations on the ground where scientists already know what the brightness should be — like a salt plain in a desert should look white, for instance — they can compare their measures to make sure the satellite sees ocean brightness correctly.
In step two, the scientists relate the measure of brightness to chlorophyll, or phytoplankton concentrations. They’ve built this enormous database of how measures of light and chlorophyll taken by water samples compare with those same measures taken by satellites at the same time and location.
This is a huge data base of relationships between the light signal and the chlorophyll concentration. We have, you know, hundreds of thousands of measurements. Using that, we are able to relate the shape of the color coming out of the ocean with how much chlorophyll would have contributed to that shape.
And step three, well, I’ll let Gene take over this one.
Satellites change over time, instruments change over time — particularly optical lenses that we measure ocean color with. So the signal that we’re trying to understand on earth about change is very very small. So for instance, the oceans may be changing at a fraction of a percent every year. But what if our instrument is changing one percent every year. It’s going to be a very difficult process.
To clarify — if the concentrations of phytoplankton have barely changed, but the optical lens becomes dirty after the first year, it might read the ocean brightness differently in year two than in year one. And it’s not that there were significant changes in the ocean, as the instrument might suggest, but rather that the optical lens is taking in less light because it got dirty.
So what we have to do is make sure that the change we’re observing is related to the change that we want to observe on the earth rather than just something that the instrument is introducing. And that’s called calibration. And we calibrate the instrument before we launch it. We do very rigorous analysis using these big spheres with lights to make sure we know what the instrument is doing.
But then we have this very delicate instrument that we’ve cared for years and nursed like a little baby, and then we put it on the back of a rocket with a hundred thousand pounds of light explosives, and light it off. And send it up into space. It’s gonna change! And so what we have to do is figure out how we monitor that change in the instrument and monitor it over time and correct for it.
We basically turn the spacecraft upside down and look at the moon once a month when it’s full, because the moon doesn’t change. If we know the geometry, the amount of light being reflected off the moon should be relatively stable. So what we do is once a month we turn the spacecraft around, we use the same instrument to look at the moon, and we integrate all the light that we see from the moon and we say ok, that signal should not have changed, so any change we see is due to change in our instrument, so we can create a correction factor to make that signal the same over time.

This is possibly my favorite part of the process, because it’s this amazing “check yourself” moment. It seems like calibration efforts — in one form or another — need to take place in all data collection, regardless of whether we are measuring the brightness of the ocean, or the prevalence of homelessness in America. Like hello, let’s hold up our efforts for a moment, turn ourselves upside down, and figure out the clarity and context of the information we’re tracking, and only then can we really determine whether we are seeing things accurately or not.
What I love so much about NASA’s process is that they value these small bottle-by-bottle collection efforts in order to make the larger, satellite world views possible. There’s an emphasis on their global “synoptic samples,” but there’s just as much respect for the scientists dropping a test tube into the ocean every kilometer, or for the community health worker measuring vital signs of patients, or for the Census bureau employee who knocks on every front door of the block just to learn how kids get to school.
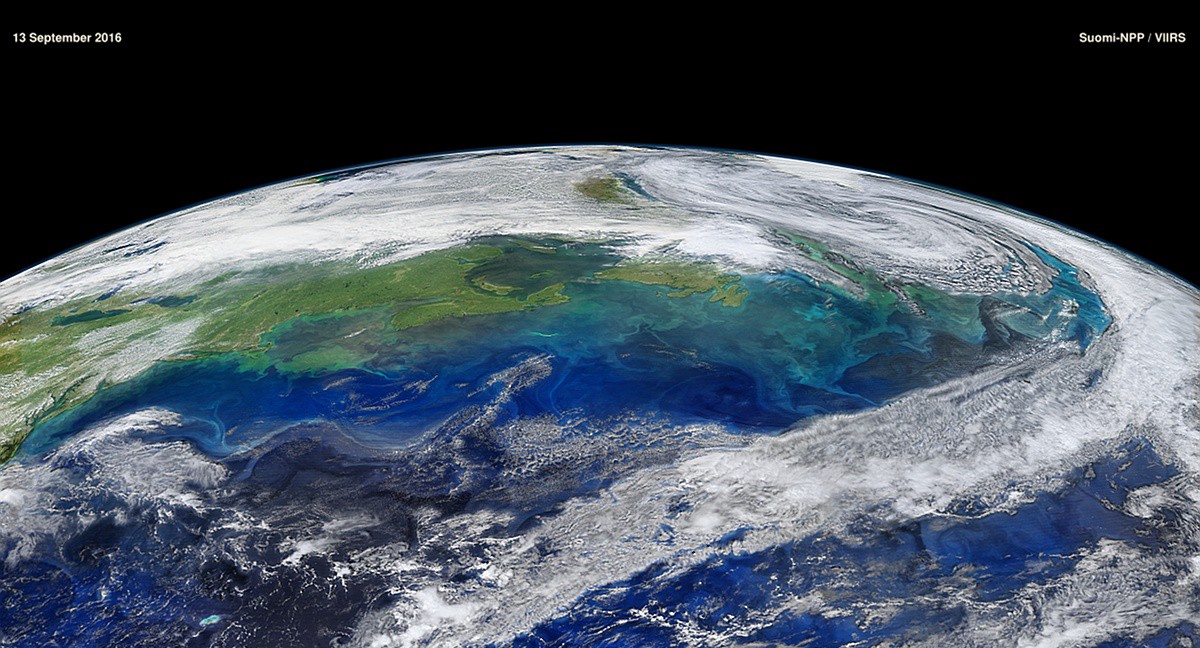
And while there are so many limitations when we gather data in piecemeal efforts, when we can combine measures over space and time, well…
You now have an image of the global biosphere. The living planet. How the planet breathes, how it responds to seasonal and annual and inter-annual changes. And that’s what’s important, because if we can monitor that, along with the forcing functions like winds, temperature, all those things that drive the system, we can then have a relationship between environmental change, and the biological consequences of that change. And if we can do that and if we can understand that, we’ll be in a better position to predict what will happen in the future as our earth continues to change, regardless of the reason why it is changing.
I want to return to a point Meryn touched on earlier, or this question of how we can act on data once it’s been collected. Of course data doesn’t give us an immediate solution for every problem. But it can help us identify issues to begin with. Stepping back, we need to remember that each dataset is really just a chapter of a much larger book. Or a series of books for that matter. It’s like one person’s glimpse at a moment in time. The more data we collect, the more we can weave different chapters together. But without knowing the author’s frame of reference and learning how far they travelled and how far the didn’t, we have no way of determining whether the lens was somehow dirtied along the way.
Thanks to the teams from the Census, Dimagi, and NASA who were kind enough to share their time and insight. Check out our first episode to learn about animal trade and the truth about your grandma’s perfume.