
The winners of the Mirador Data Competition are:
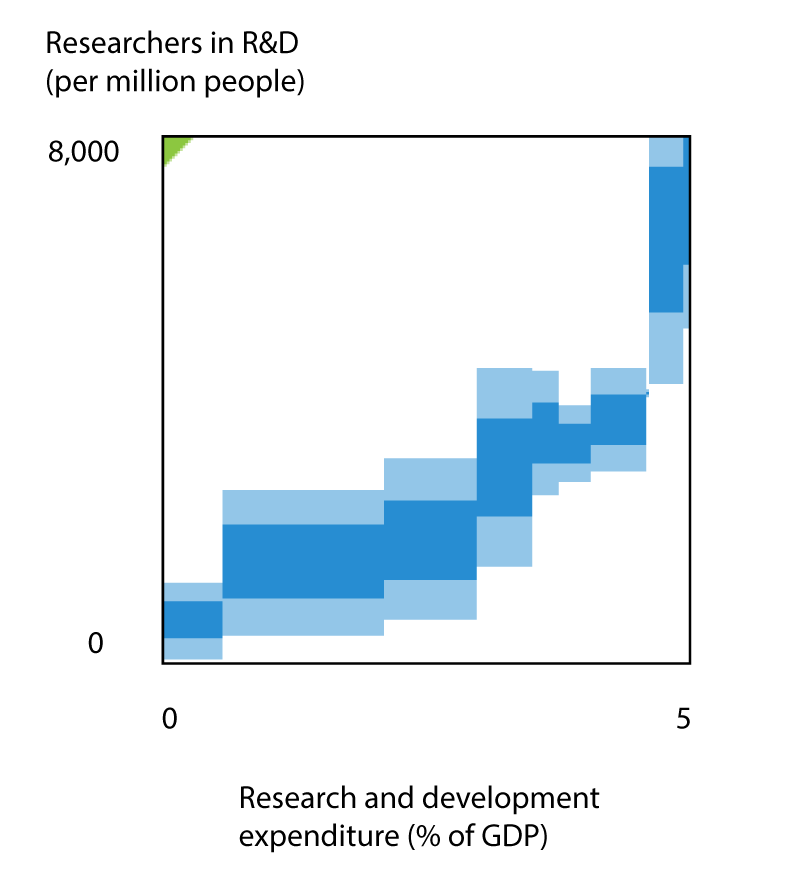
- First prize: Maria Fernanda Gándara. Correlation between Researchers in R&D and Research and development expenditure, from the World Bank Development Indicators.
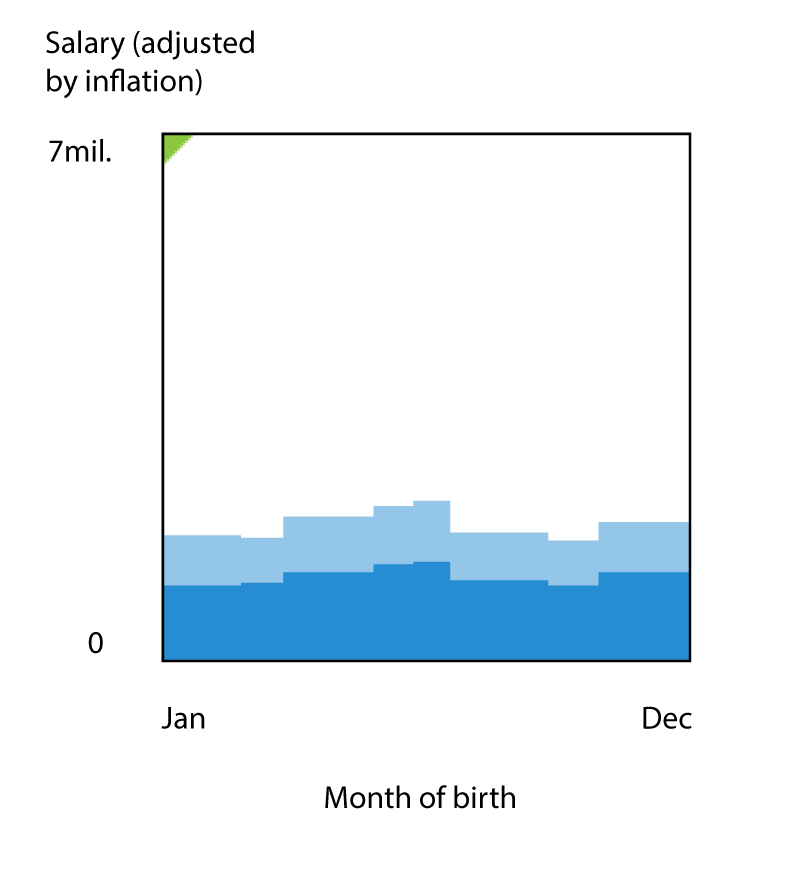
- Second prize: Yuliia Khodakivska. Correlation between Salary and Month of Birth in the 2013 Lahman's Baseball Database.
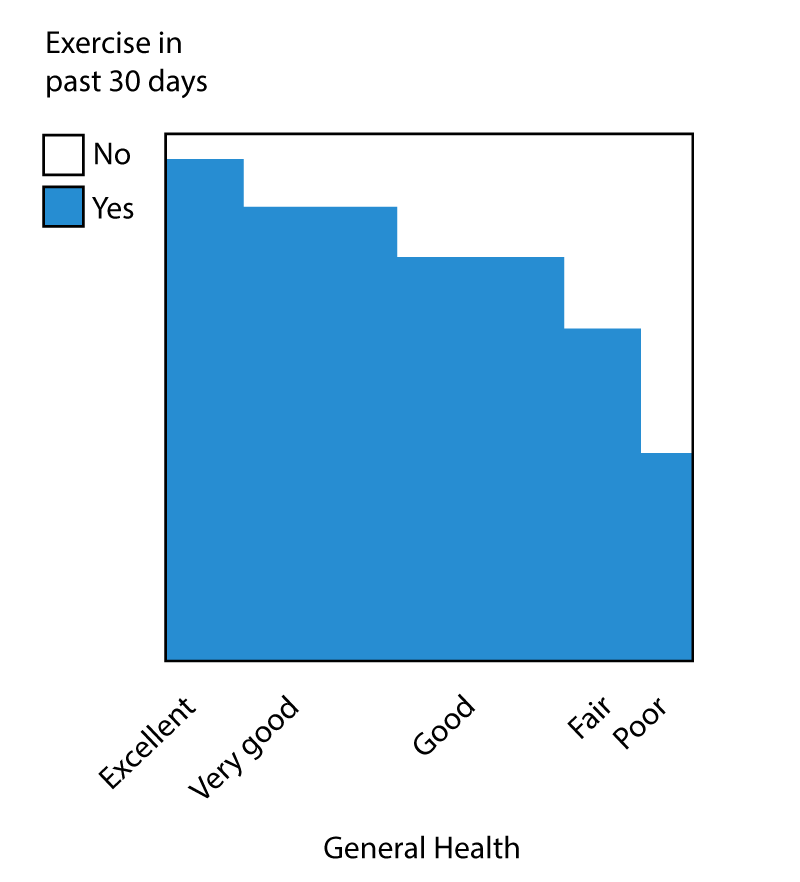
- Third prize: Ching-Hsing Wang. Correlation between General Health and Exercise in the past 30 days, from the 2012 Behavioral Risk Factor Surveillance System.
We believe these three correlations were worth choosing because they give us a glimpse of complex socio-economic processes, and highlight the potential of tools such as Mirador for generating tentative new hypothesis, as well as pointing to their limitations and possible improvements.
Findings were submitted as eikosogram plots, a representation that Mirador uses to explore many variables at once. I've gone into more detail about eikosograms in an earlier post. In order to elaborate on the winning entries I created three custom interactive versions that can be explored below. I tried to re-interpret them with a visualization that is better suited for each particular dataset.
First prize: Maria Fernanda Gándara. Outliers in Research and Development Expenditure
Although it might be somewhat expected, the more resources a country invests in R&D, the more people become researchers. But this submission reveals complex patterns of R&D investment and "resulting" number of researchers that vary widely across time and between countries. The visualization below shows a plot of the ratio of number of researchers per GDP percentage invested in R&D next to the original scatter plot. Are some countries more effective at training researchers for a given percentage of GDP investment?
Interact with the charts below to explore this question.
This visualization includes all countries in the Europe, Central Asia, and North America regions, between 2000 and 2013. However, María Fernanda also considered the percentage of secondary female teachers as a covariate in her analysis. You can explore the effect of this variable by clicking the following links to update the plot above. Show countries where the percentage of female teachers is less than 50%, more than 50%, or without constraint. According to María Fernanda "I explored for possible covariates that could strengthen the relationships, and that is how I chose the additional covariate of percentage of female teachers in secondary education. Therefore, the constrain of “percentage of female secondary teachers > 50%” was statistically based (in an exploratory fashion). I do think it can be interpreted, though. Since researchers are typically men, the more women working in secondary education, the more men "available" to become researchers."
Second prize: Yuliia Khodakivska. The Boys of Mid-Summer?
The second prize entry is a very interesting correlation pointing to the fact that player salaries in Baseball are influenced by many artificial effects, such as fixed pay scales and team caps. The data shows that players born in July have the highest median salaries in the league.
Somewhat related, an article from a few years ago shows that the month of birth for an American League player peaks on August, however this happens only for U.S. born players, non-U.S. players don't seem to be born in August on significantly higher proportions.
In order to visualize all these patterns, I added the birth counts for U.S. and non-U.S. born players for each month of the year, alongside the median salary as a function of month of birth. All these numbers were derived from the 2013 release of the Lahman's database.
Interact with the chart below to explore further.
Strangely enough, the peak in the median salary occurs in July, not August as one would expect following the argument in the article. Is this a real effect, or the result of a bug in the code or data? You can download our scripts to check for yourself. Our winner told us about her initial motivation to look at this correlation. Yuliia writes, "an article called How Common Is Your Birthday? (and data source) [...] It contains infographics showing that July, August, and September seem to have more births, comparing to winter times."
Third prize: Ching-Hsing Wang. Exercise and Health
A correlation between exercise and health could also be considered "expected", as people who exercise regularly are probably in better health than those who do not (although the link to specific causal factors is less straightforward). The source is the CDC's Behavioral Risk Factor Surveillance System, which is a phone-based health survey conducted every year to collect data on a variety of factors (demographics, alcohol consumption, employment, etc.)
Here, I thought it would be useful to take Ching-Hsing's original submission and make it more general in this visualization, allowing readers to explore different association patterns. In order to control, at least to some extent, for confounding effects that might be influencing both general health and exercise, I restricted the visualization to respondents younger than 50 years who don't report activity limitation due to health problems. It is interesting to see how the proportions of health levels change between males and females and across income groups.
Interact with the chart below and toggle between sex and income.
For instance, the proportion of exercising females who report excellent health is 4% higher than for exercising males in the top earning group. However, this difference reverts for lower income respondents: exercising males report higher excellent health than females. Are these patterns simply the result of random fluctuations in the sample data or due to real effects?
Representing correlations using eikosograms
In Mirador, correlations are primarily visualized with eikosograms. I've gone into more detail about them in an earlier post and online documentation. The figure below summarizes how to interpret an eikosogram plot:
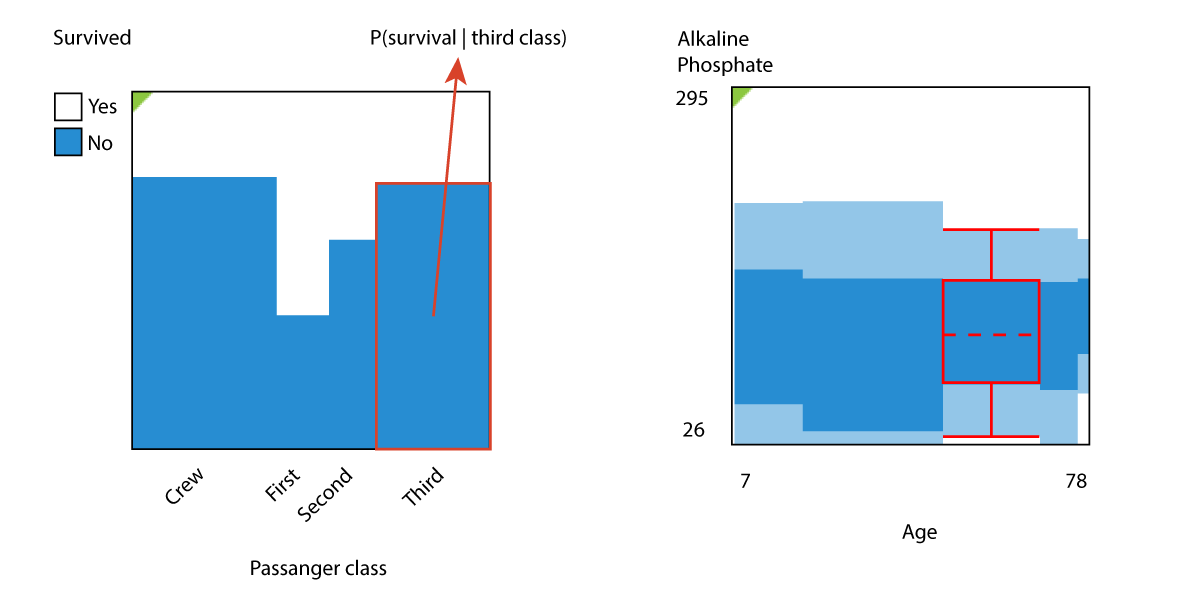
The eikosogram is constructed differently depending on whether the Y variable is nominal or numerical. In the former case, the vertical columns represent the conditional probability of each value of the Y variable given the X category. In the former, a boxplot is constructed for each value of X, and the entire eikosogram is formed by all these boxplots placed next to each other. The dark blue box contains values one standard deviation around the mean, while the light blue extends up to two standard deviations.
Although the interpretation of the eikosogram is different depending on the variable type, in all cases it is easy to visually identify a correlation: unrelated variables have a flat eikosogram, because either the conditional probabilities or the boxplots are independent of X. It is also important to note that the scale of the X variable is not linear: the width of each X bin is proportional to the number of samples falling within that bin.
Users in Mirador can also define arbitrary data ranges in order to control by various covariates or to stratify the sample into subpopulations of interest. Some of the submissions used covariates, while others were reported on the entire sample. The next gallery shows the three winning correlations as they were displayed in Mirador:
Some concluding thoughts
More rigorous analysis would need to be conducted in order to interpret these correlations, but the goal of exploratory tools such as Mirador is to reveal plausible patterns of association, and let users quickly visualize hypothesis based on their intuition and prior knowledge. Any correlation discovered with these tools should be regarded only as a suggestion for further analysis, which is also contingent on the context where one is carrying out the use of these tools: whether in education, research, or applied practice.
It could be argued that one can play with covariates in Mirador until finding a statistically significant association, but as contestant María Fernanda pointed out, this is valid practice in "data-driven" exploratory analysis: the interpretation stage comes later, at which point one can discard the correlation altogether, or conduct further analysis using more powerful tools or better datasets. The feedback received from users so far has been very positive, highlighting both Mirador's advantages (free availability, ease of use, interactive correlation analysis) and the areas where it could be improved (inclusions of other datasets, better scatter plot functionality, more advanced statistical analysis).
Data and code availability
The code that generates the data files used in this blog post and the JavaScript visualizations is hosted on this repository. Follow the next links to download the individual data files for the first, second, and third entries.
Acknowledgments
We would like to recognize all the participants of the Mirador Data Competition for their submissions, and Gregory Piatetsky-Shapiro for helping us announce the competition. I would also like to thank the feedback from Tariq Khokhar on the World Bank submissions, Sean Lahman on the baseball correlations, and Pearly Dhingra for the insightful discussions about associations in health data and confounding effects. Finally, many thanks to Lauren McCarthy and the rest of the p5.js team. All the interactive visualizations were created with Processing and ported to p5js.
We’d love to hear what you’re working on, what you’re curious about, and what messy data problems we can help you solve. Drop us a line at hello@fathom.info, or you can subscribe to our newsletter for updates.