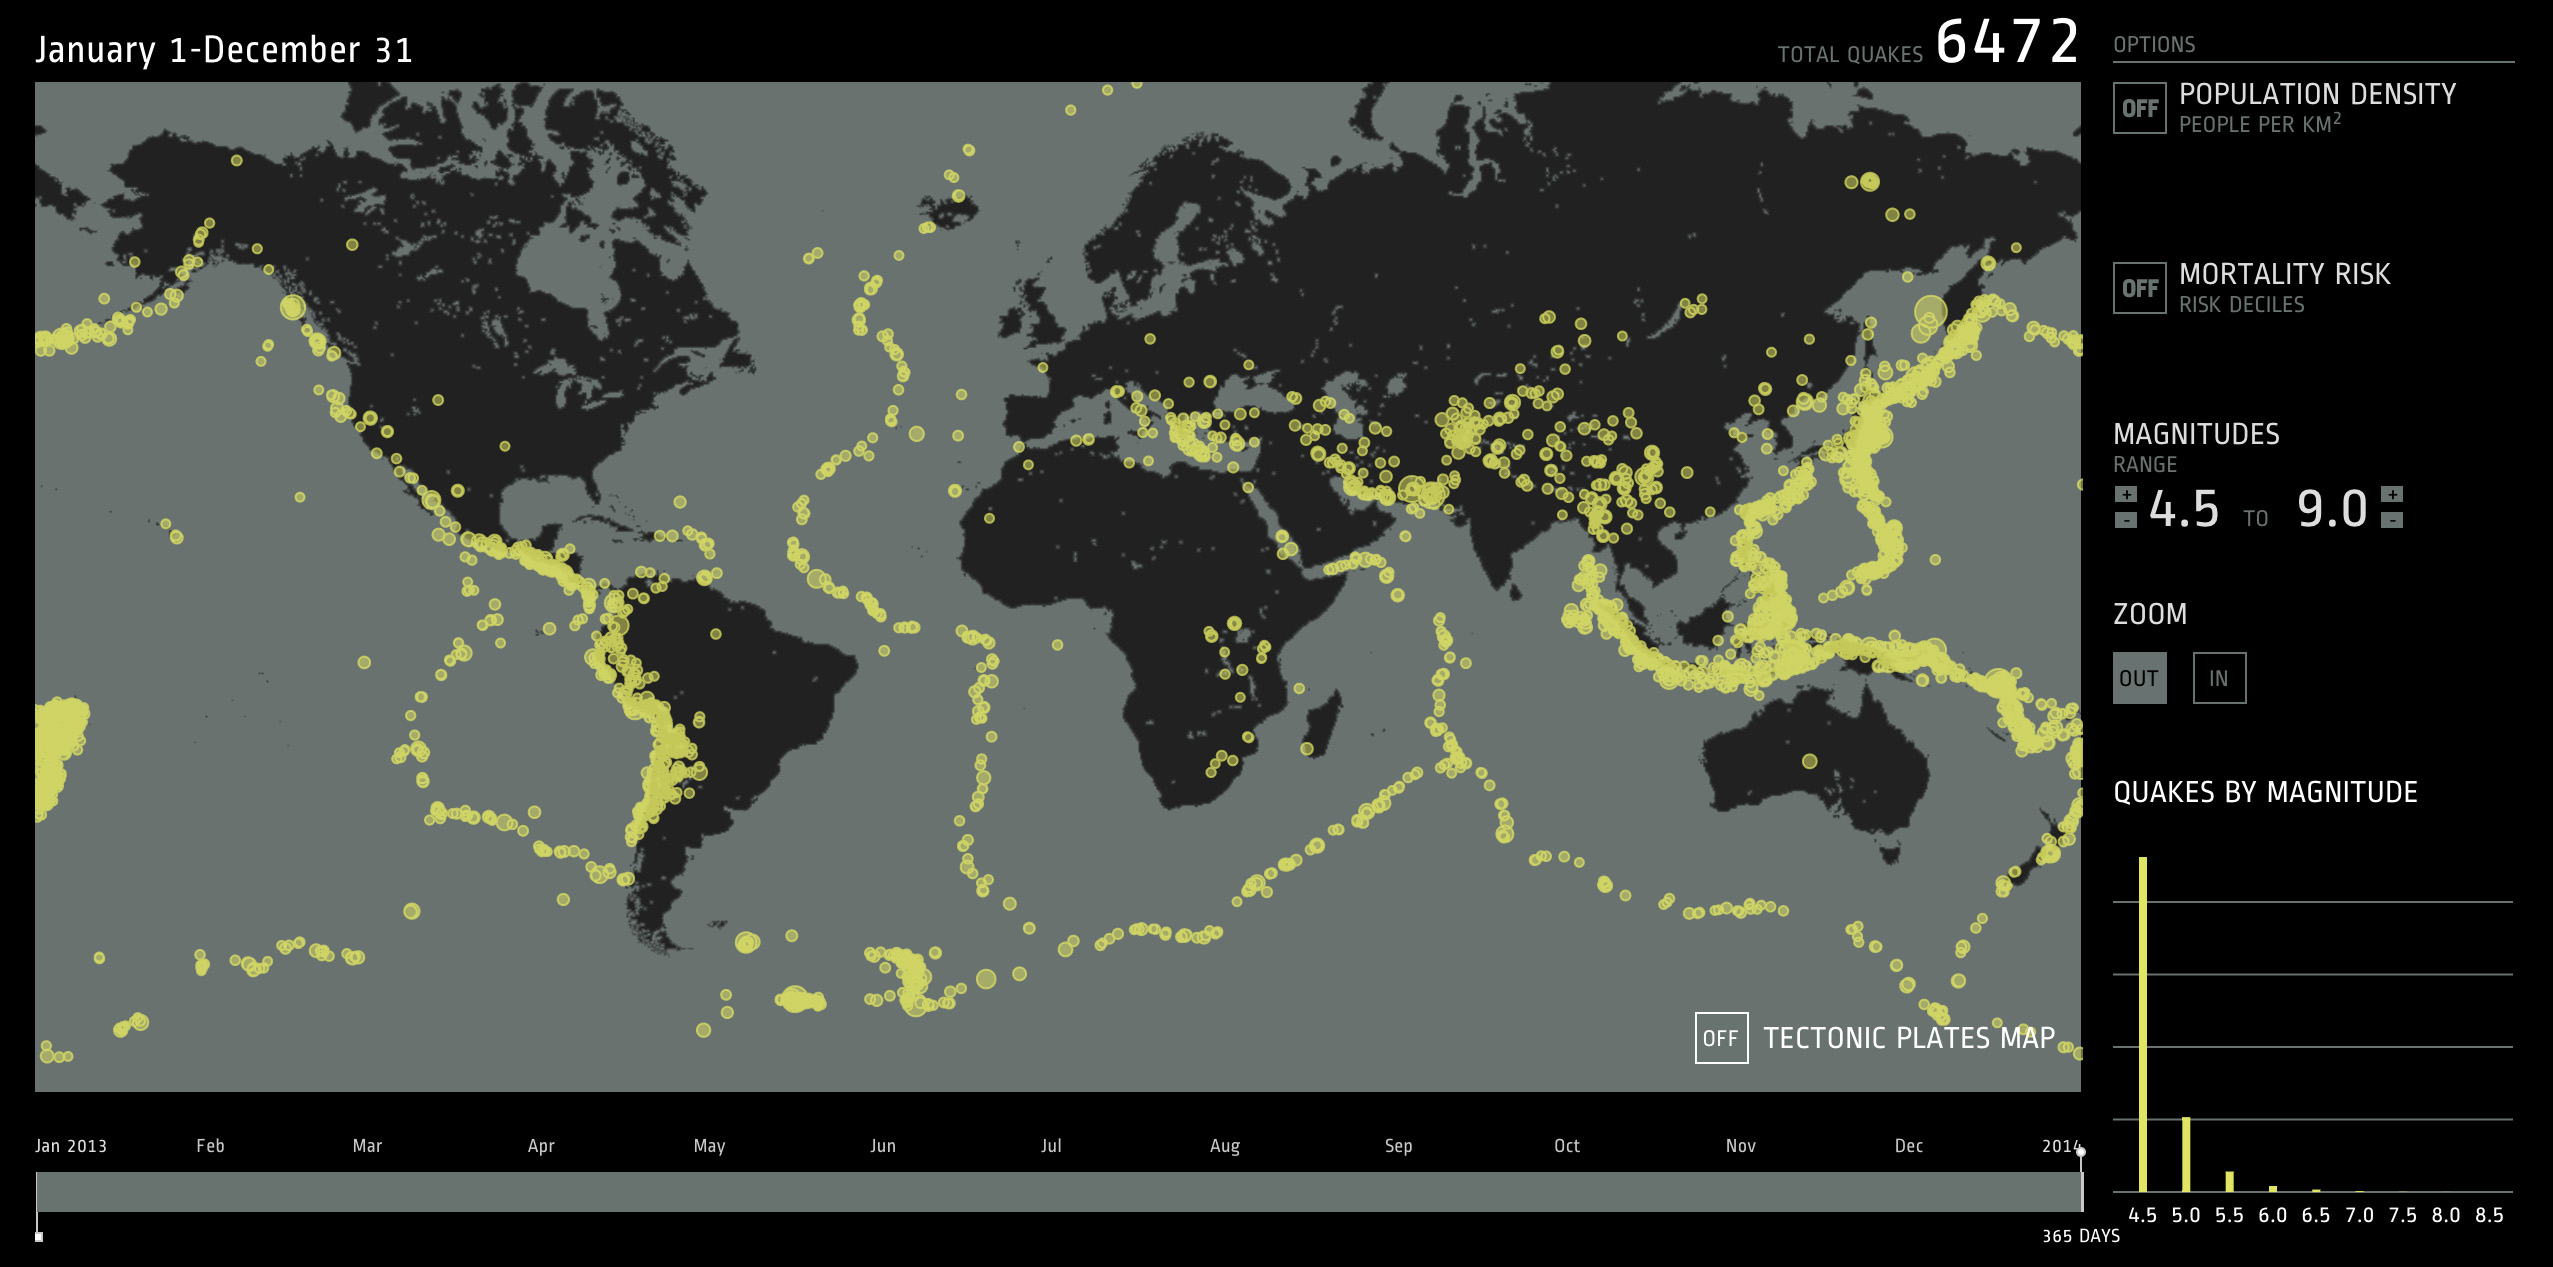
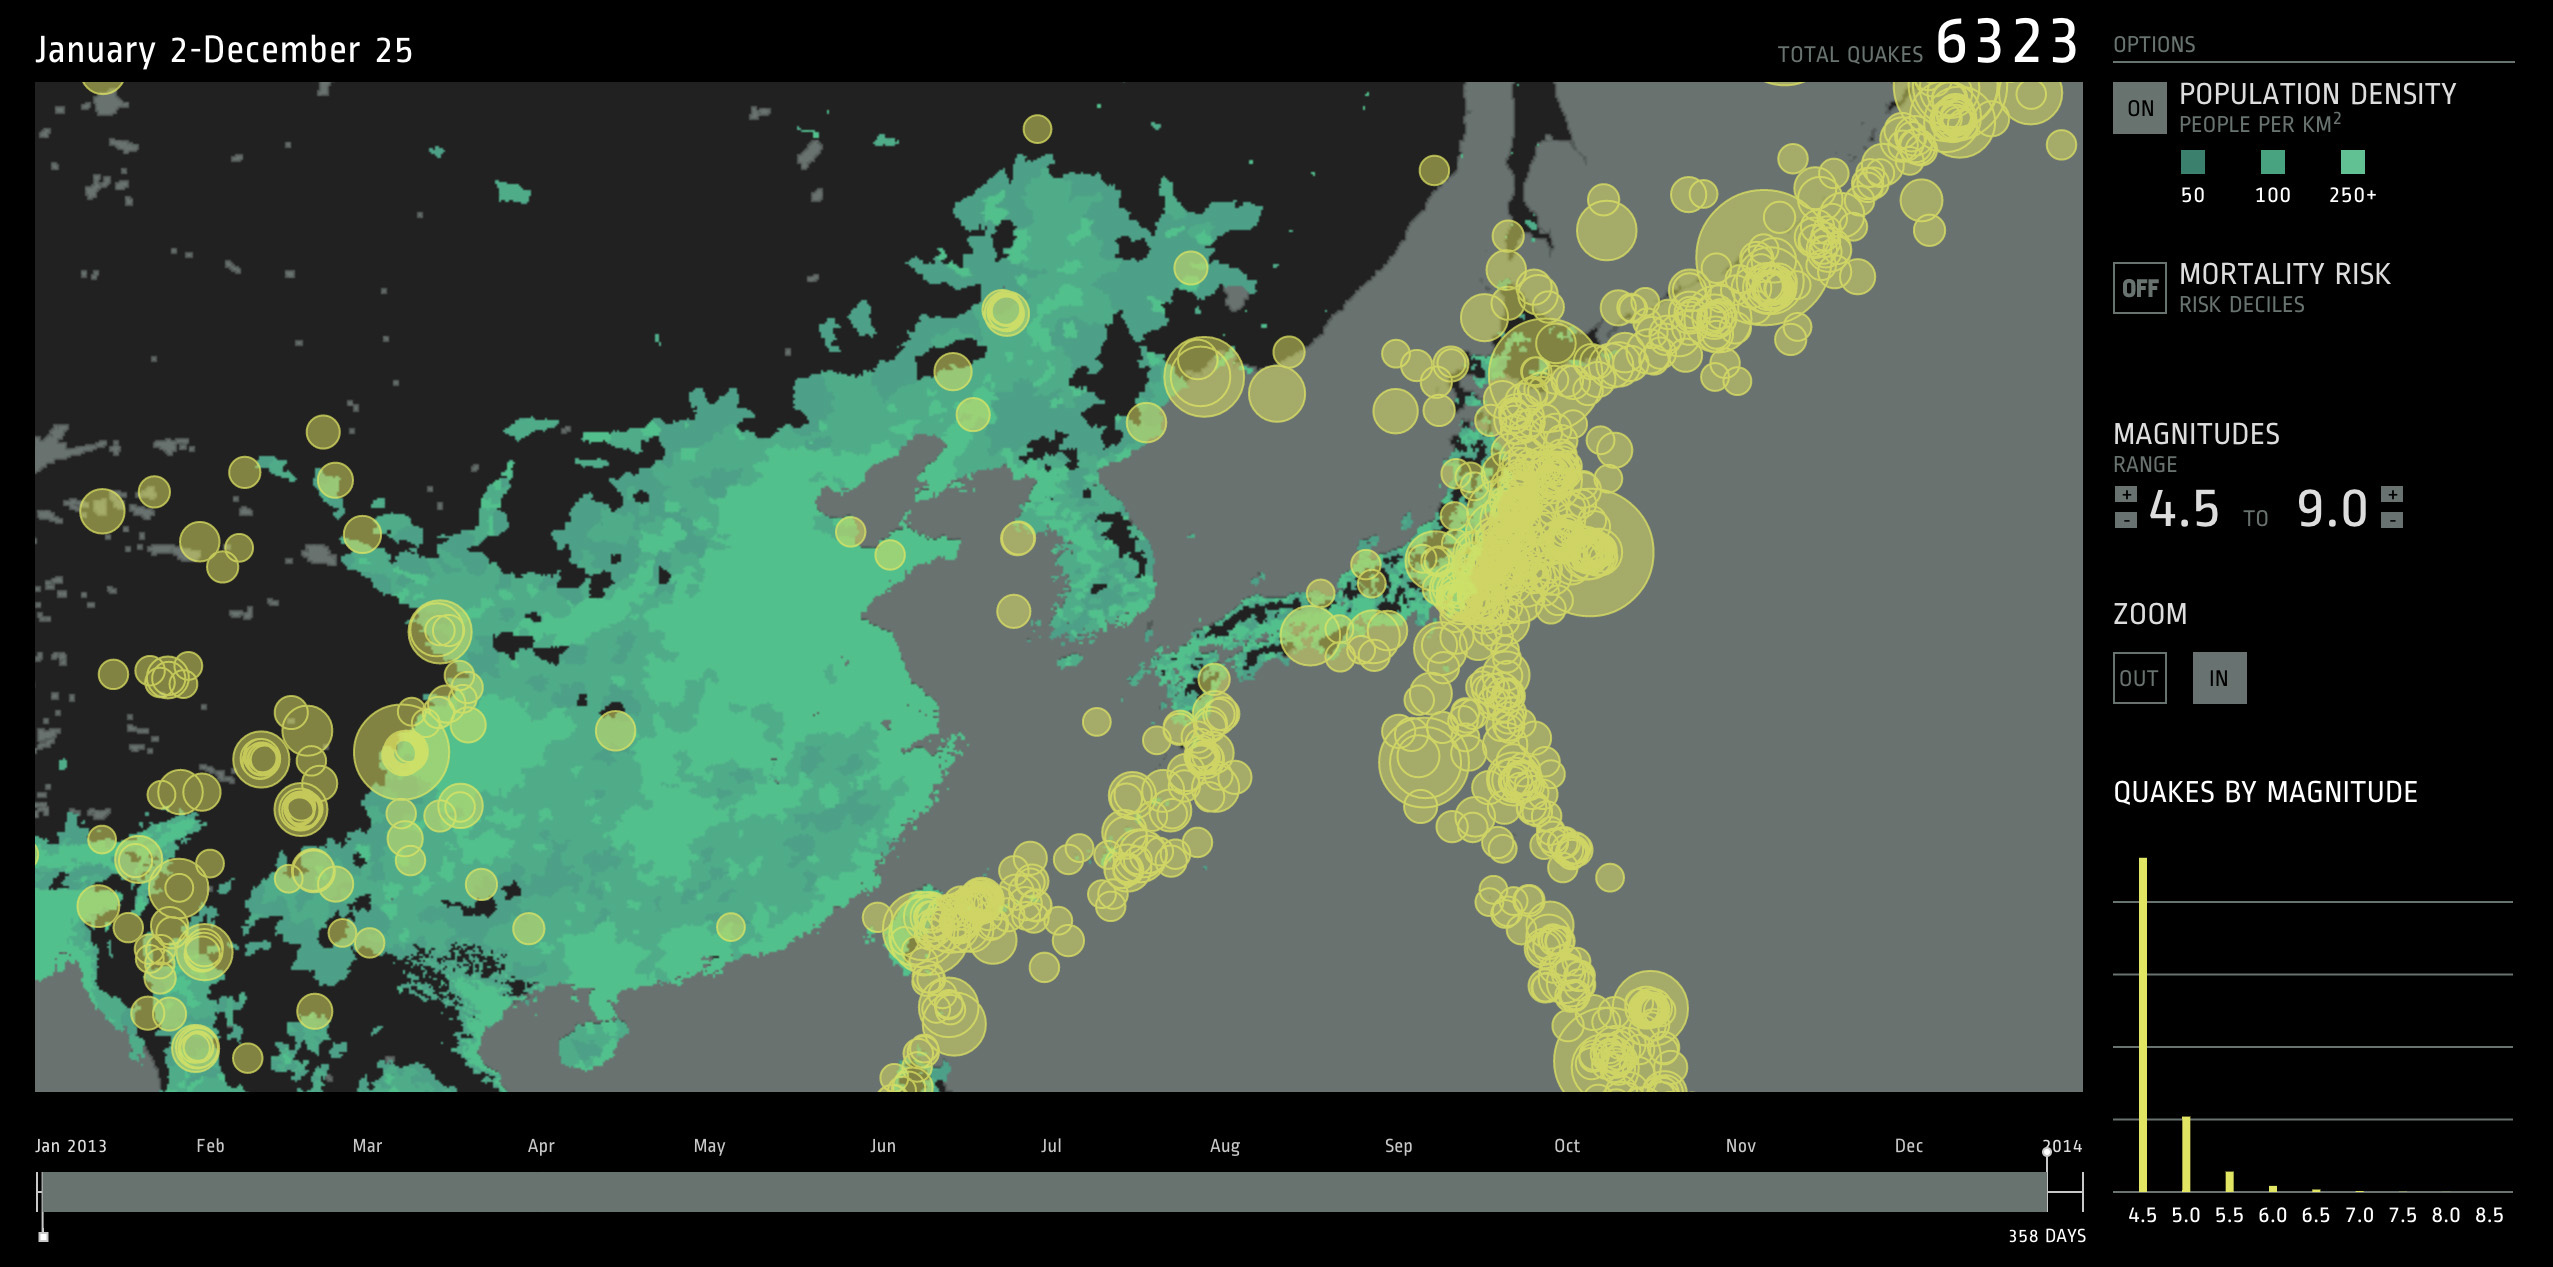
I had always thought of earthquakes as dramatic, irregular events, when in fact there are tens of thousands of earthquakes each year that people cannot even feel. Back when I was in school, I made a print piece that looked at the number and magnitude of earthquakes occurring throughout a full year. As you can see in our more recent project, there were over 6,000 earthquakes globally in 2013 (and that's only looking at those with a magnitude of 4.5+!). In fact, there are over a million earthquakes each year, but most are too small to notice.
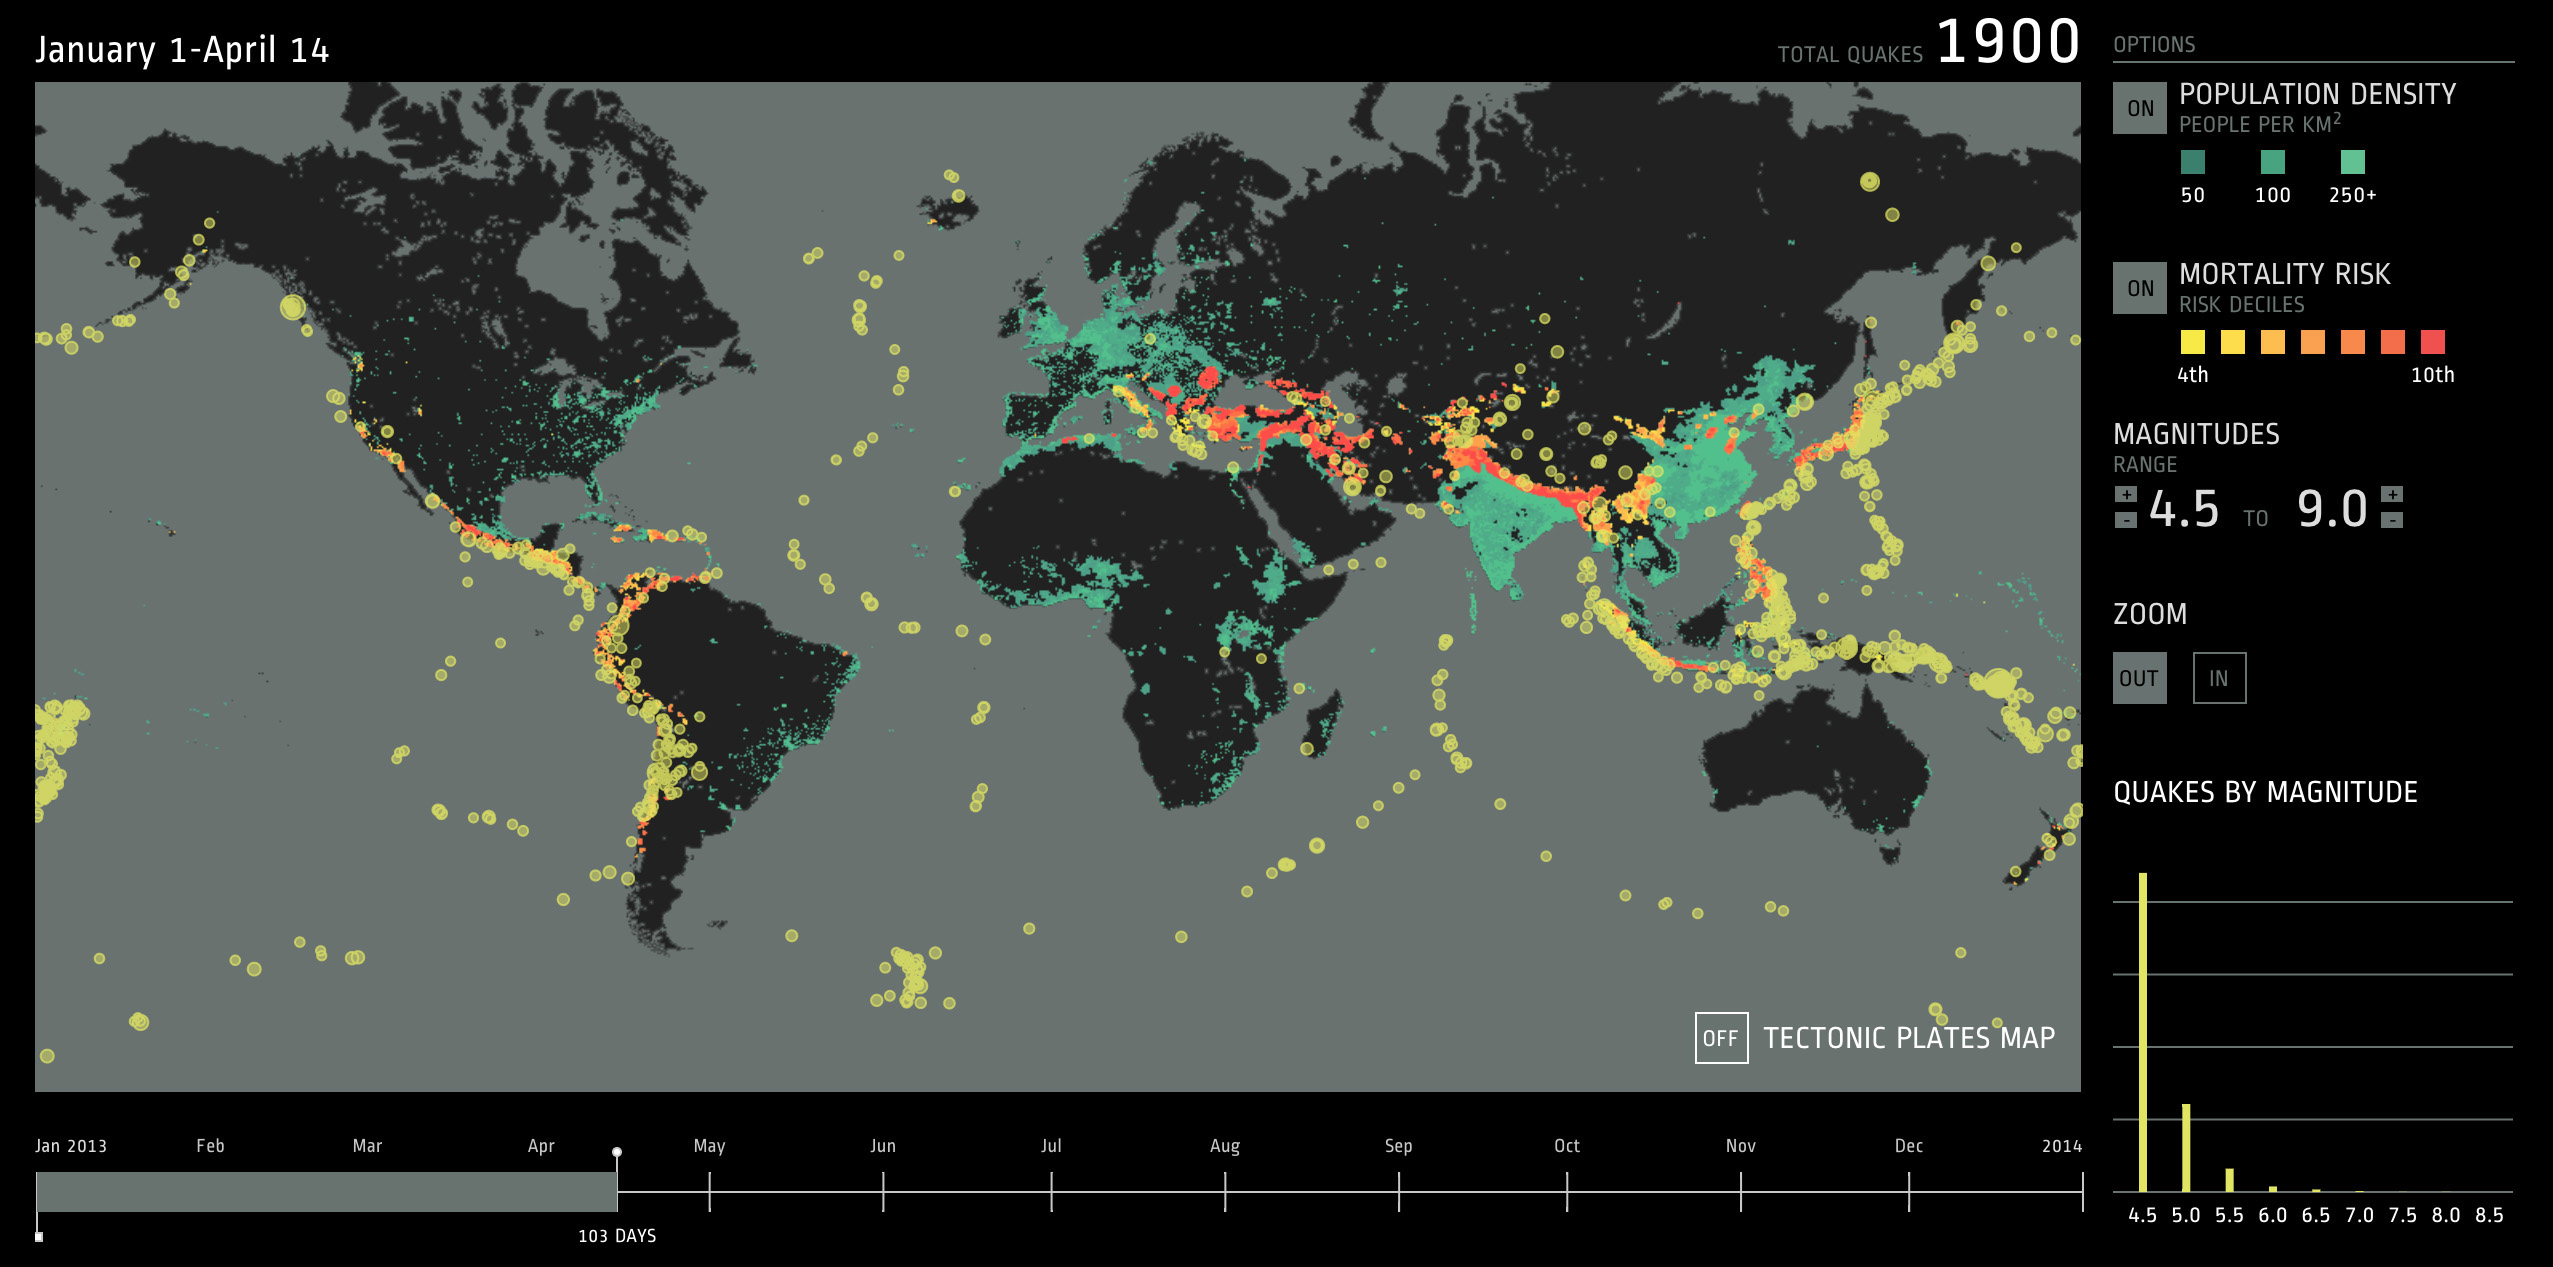
Within the dataset pulled from the U.S. Geological Survey, we focused on the earthquakes' magnitudes, locations, and dates of occurrence. The tool allows you to focus on a particular subset of earthquakes by limiting the timespan, range of magnitudes, and map extent. On the other hand, you can maximize the timeframe and magnitude range to get a picture of the whole year.
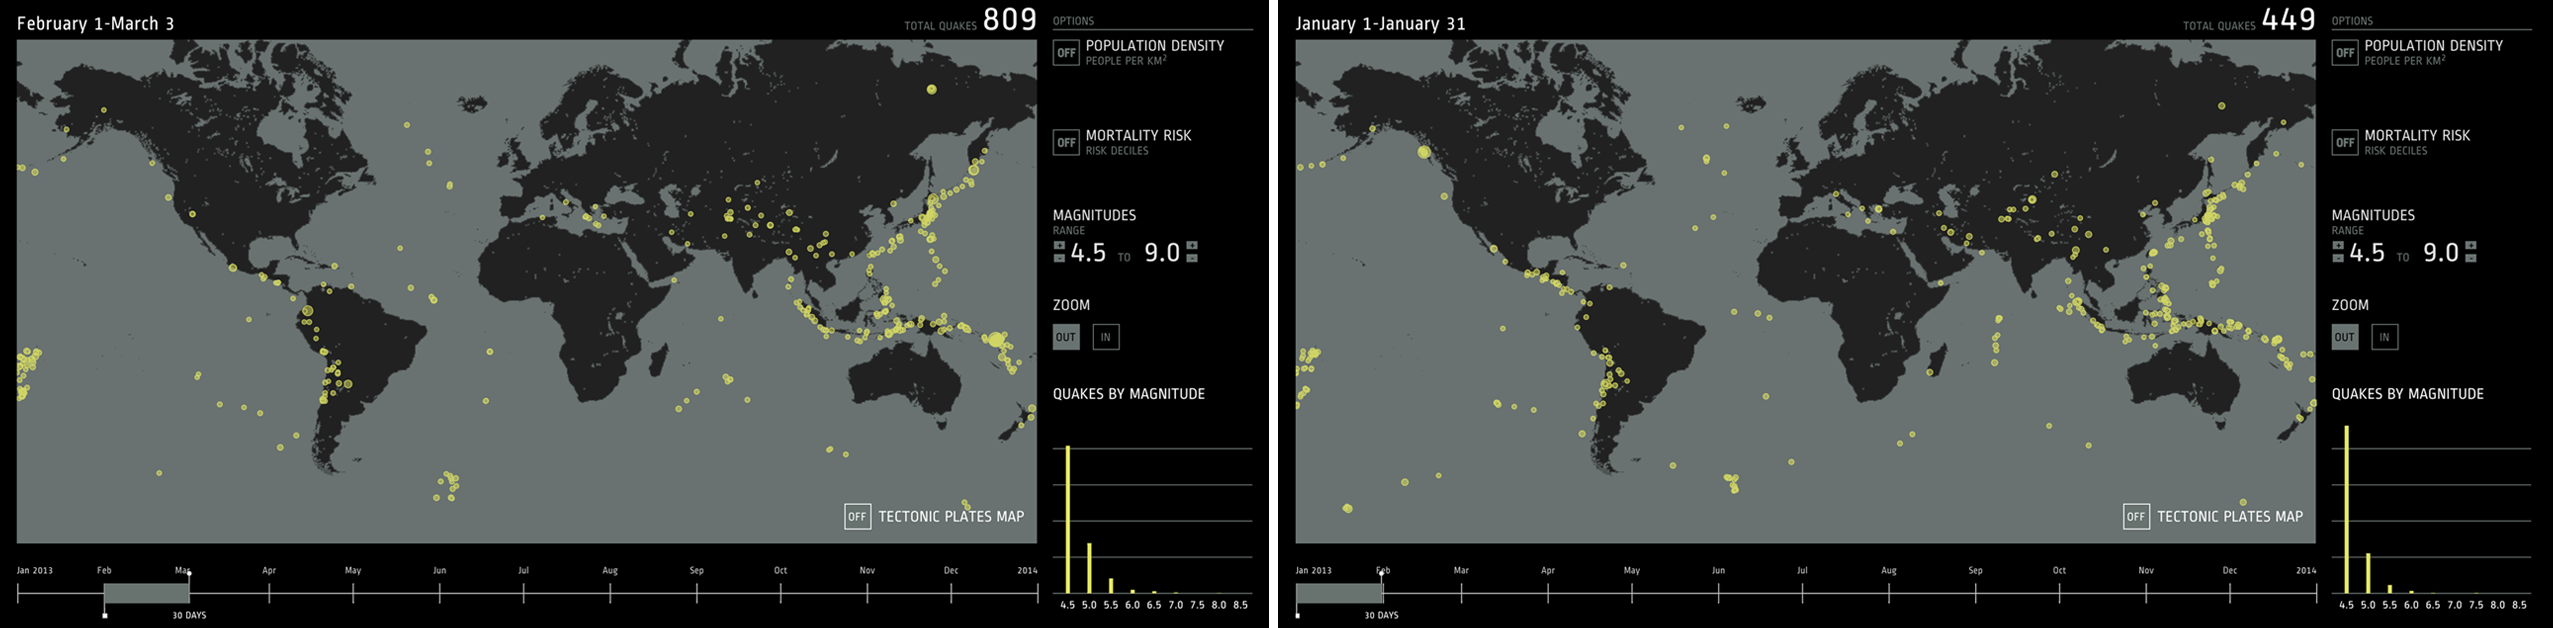
When comparing time intervals of the same length (for example 30 days), the ratio of magnitude 4.0-4.9 earthquakes to magnitude 5.5-5.9 to magnitude 6.0-6.5 earthquakes, etc. stays about the same. However, the total number of earthquakes can vary dramatically. A 31-day span starting in January had 449 earthquakes, while the 31-day span starting in February had 809.
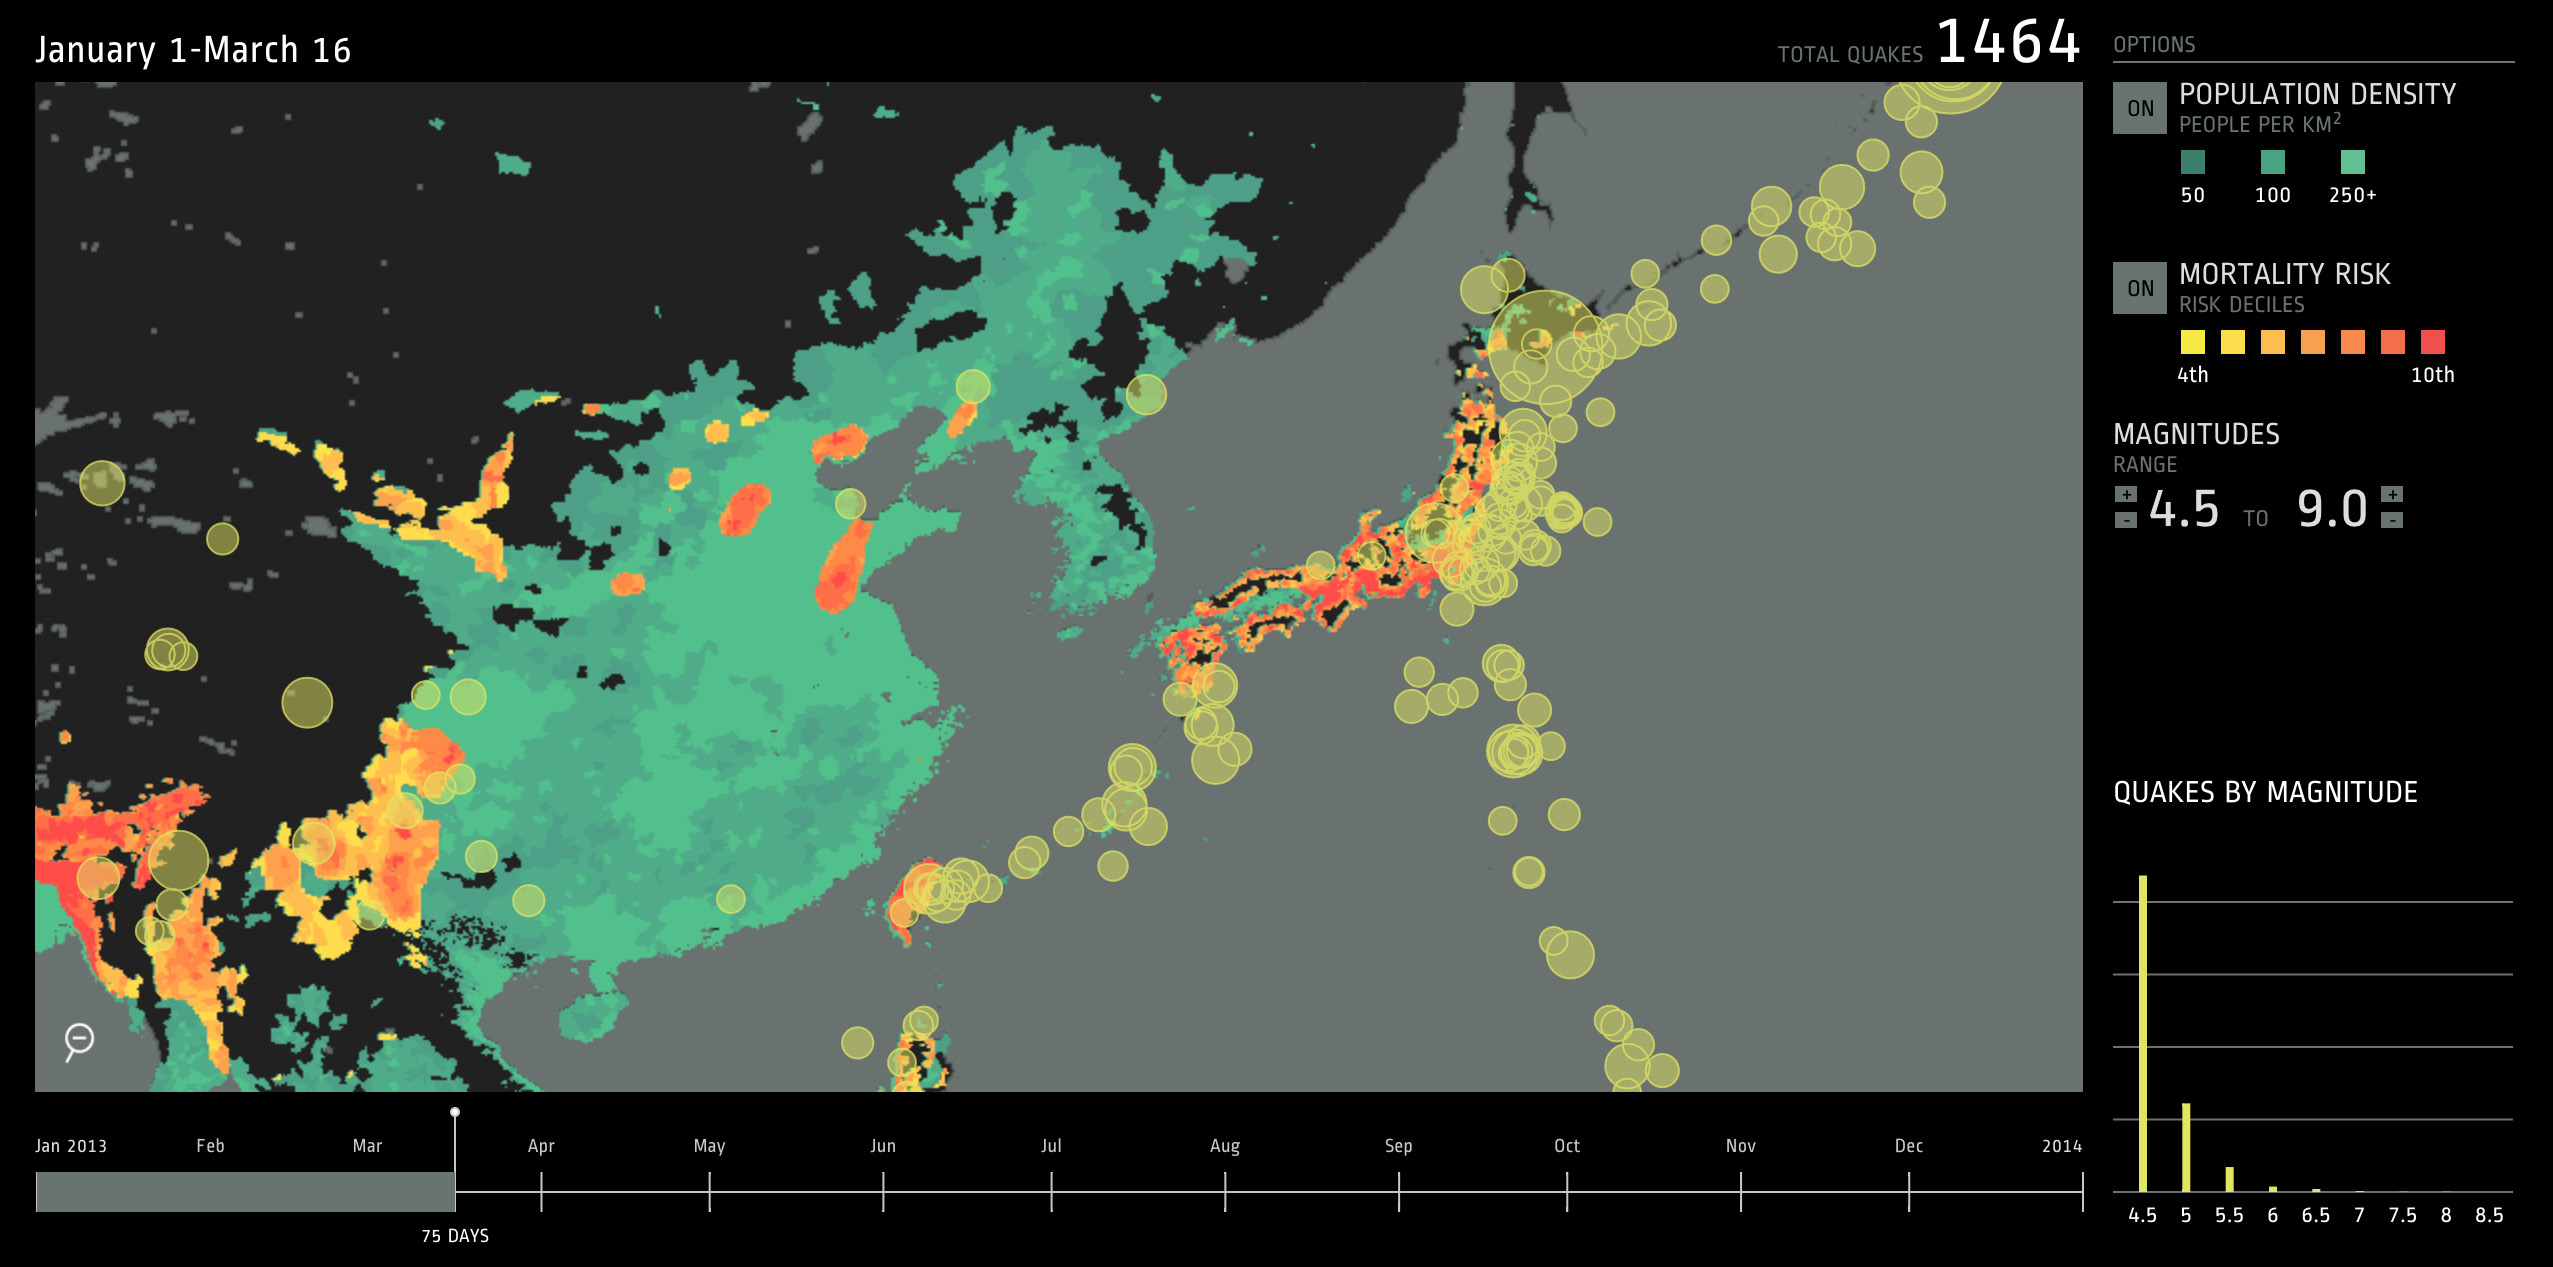
The tool revealed hot spots of seismic activity. By including population density as a layer, we could begin to see areas of high risk. For example, Japan and much of East Asia are densely populated along the coasts — an area that is also host to a large percentage of the world's earthquakes.
East Asia experiences some of the year's largest earthquakes measuring over 7.0 on the Richter scale, putting many of these areas in the top mortality risk deciles.

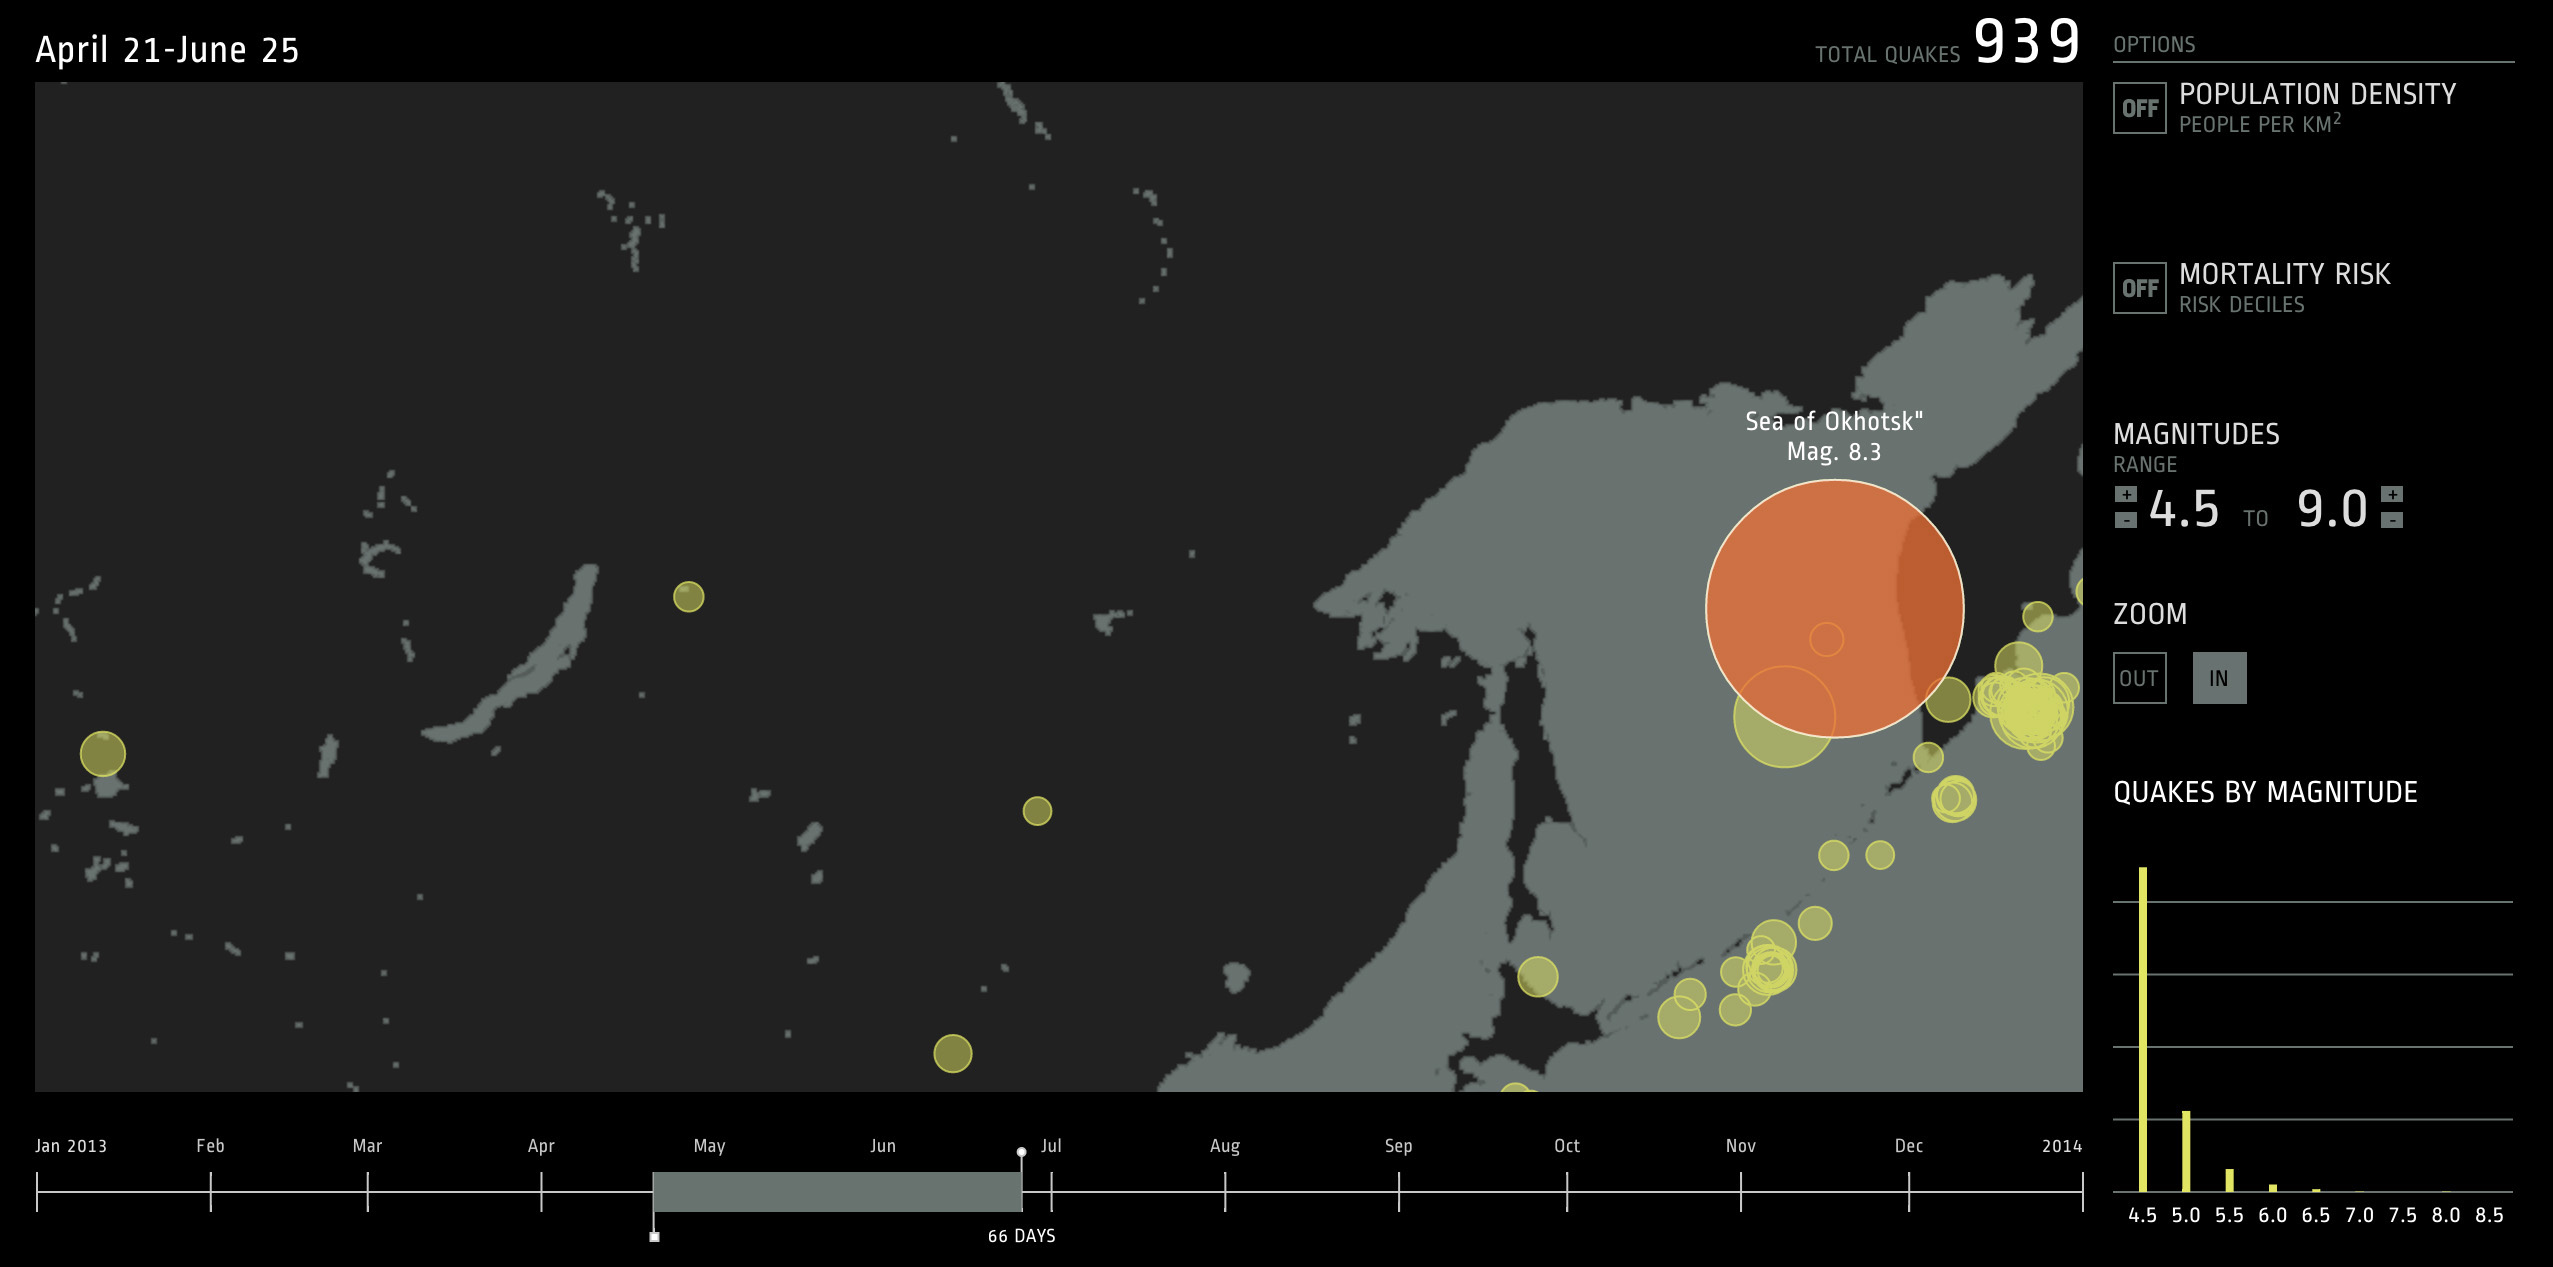
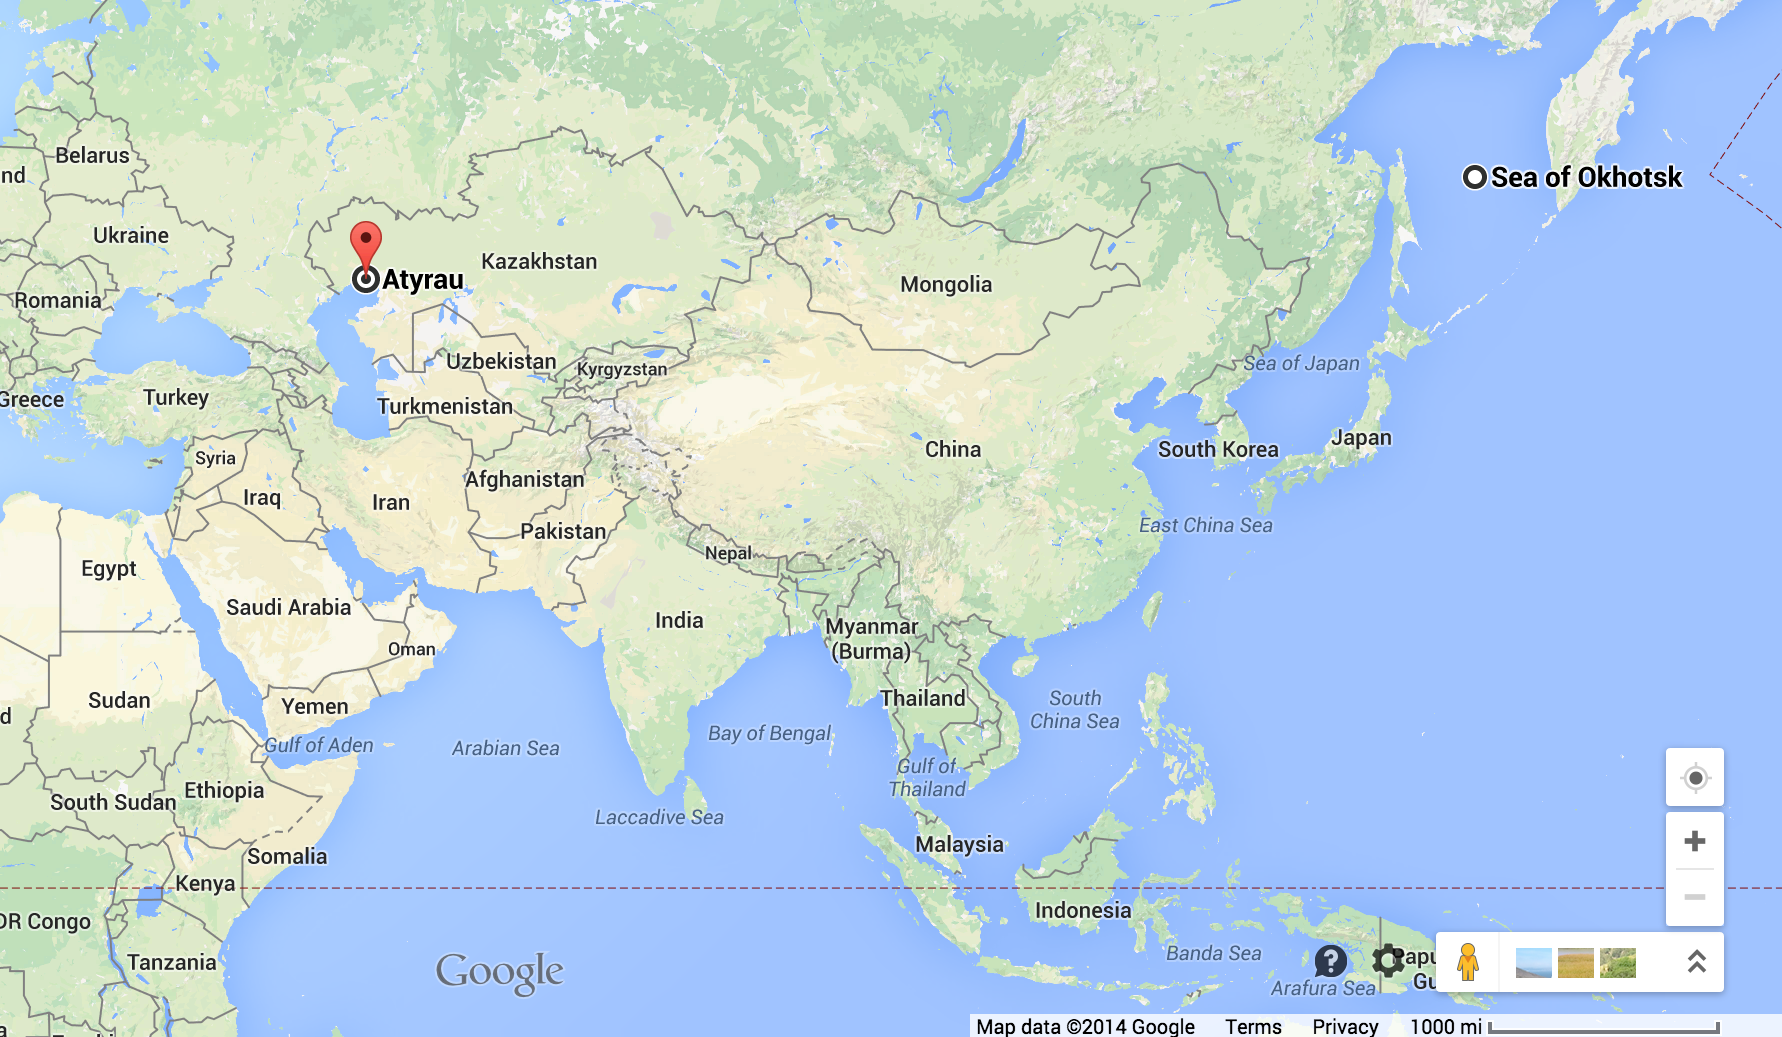
The largest earthquake in 2013 actually occurred deep in the ocean off the coast of Russia. Luckily, its depth prevented massive damage, but the tremors could be felt thousands of miles away.
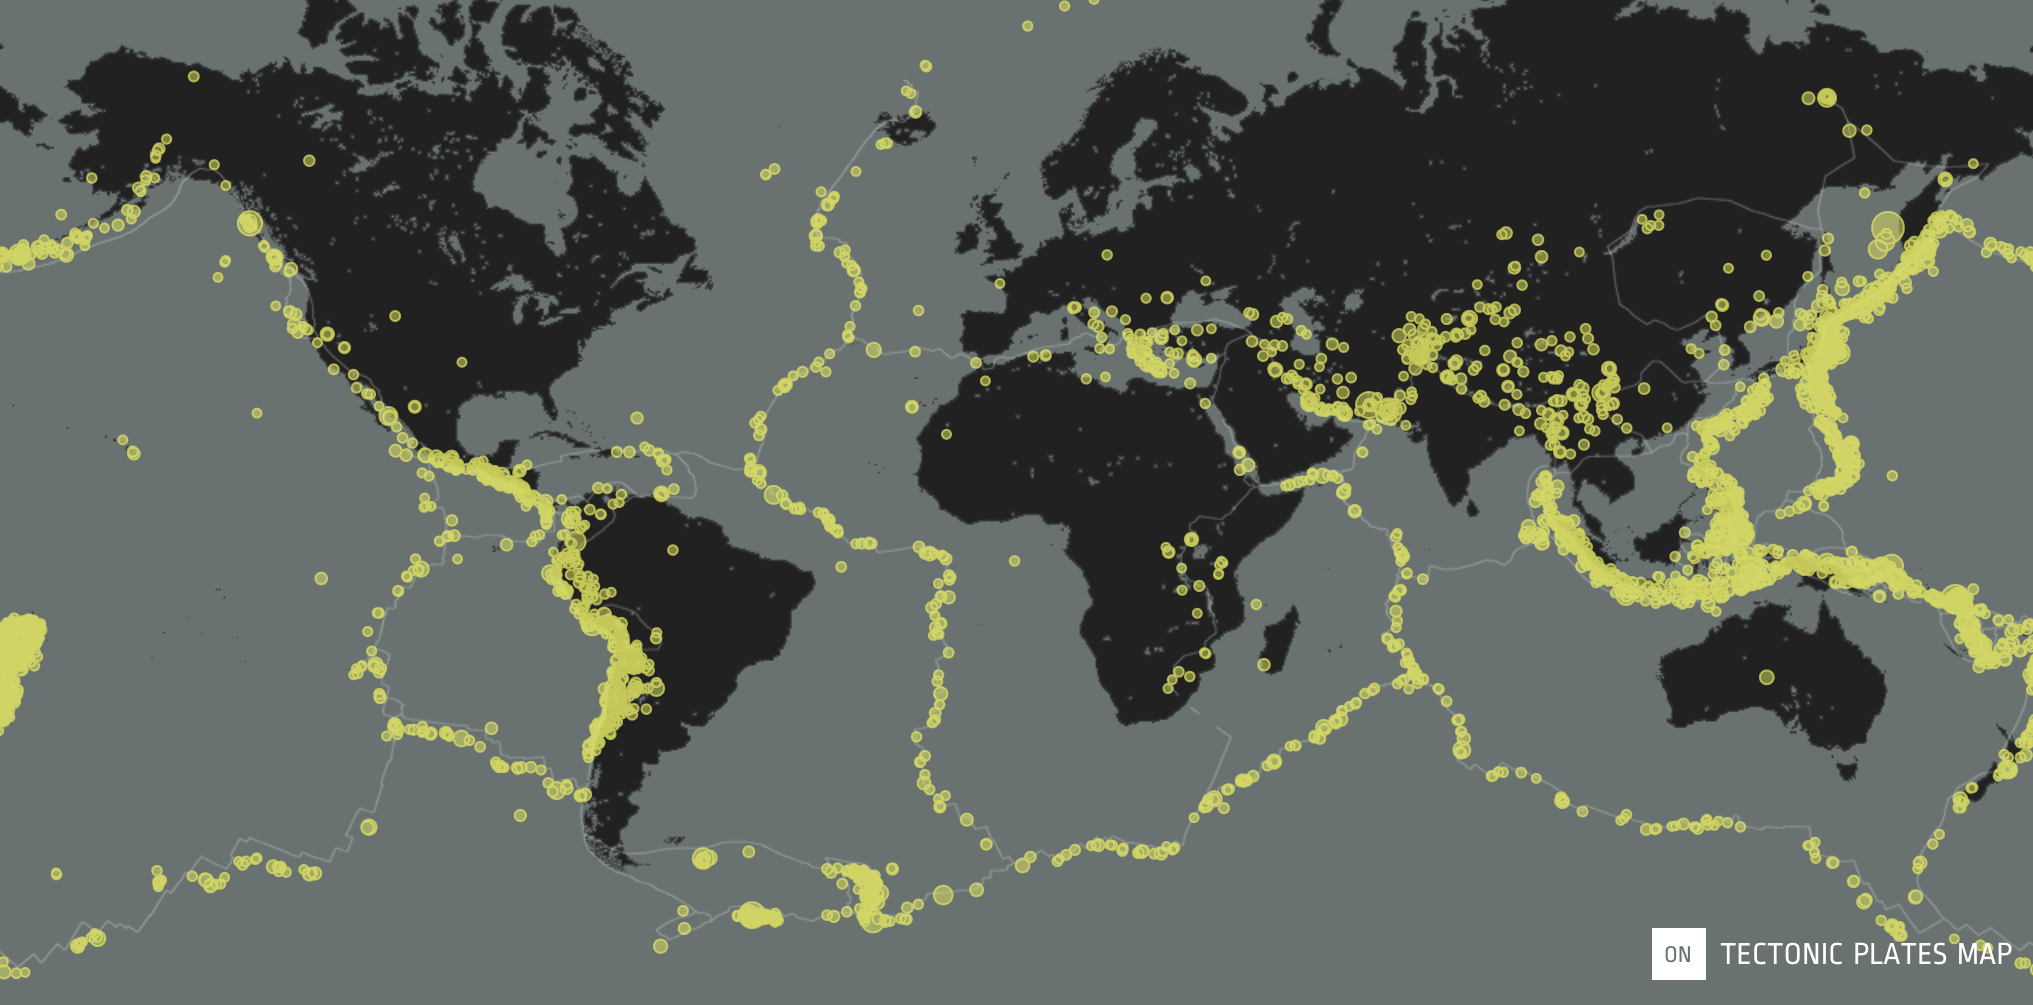
Areas like East Asia, the Himalayas and the U.S. West Coast experience a large amount of earthquakes because these areas lie directly on top of tectonic plate fault lines. On the other hand, areas like the U.S. East Coast, Australia and most of Africa experience little to no seismic activity throughout the year due to their locations in the centers of tectonic plates.
We’d love to hear what you’re working on, what you’re curious about, and what messy data problems we can help you solve. Drop us a line at hello@fathom.info, or you can subscribe to our newsletter for updates.