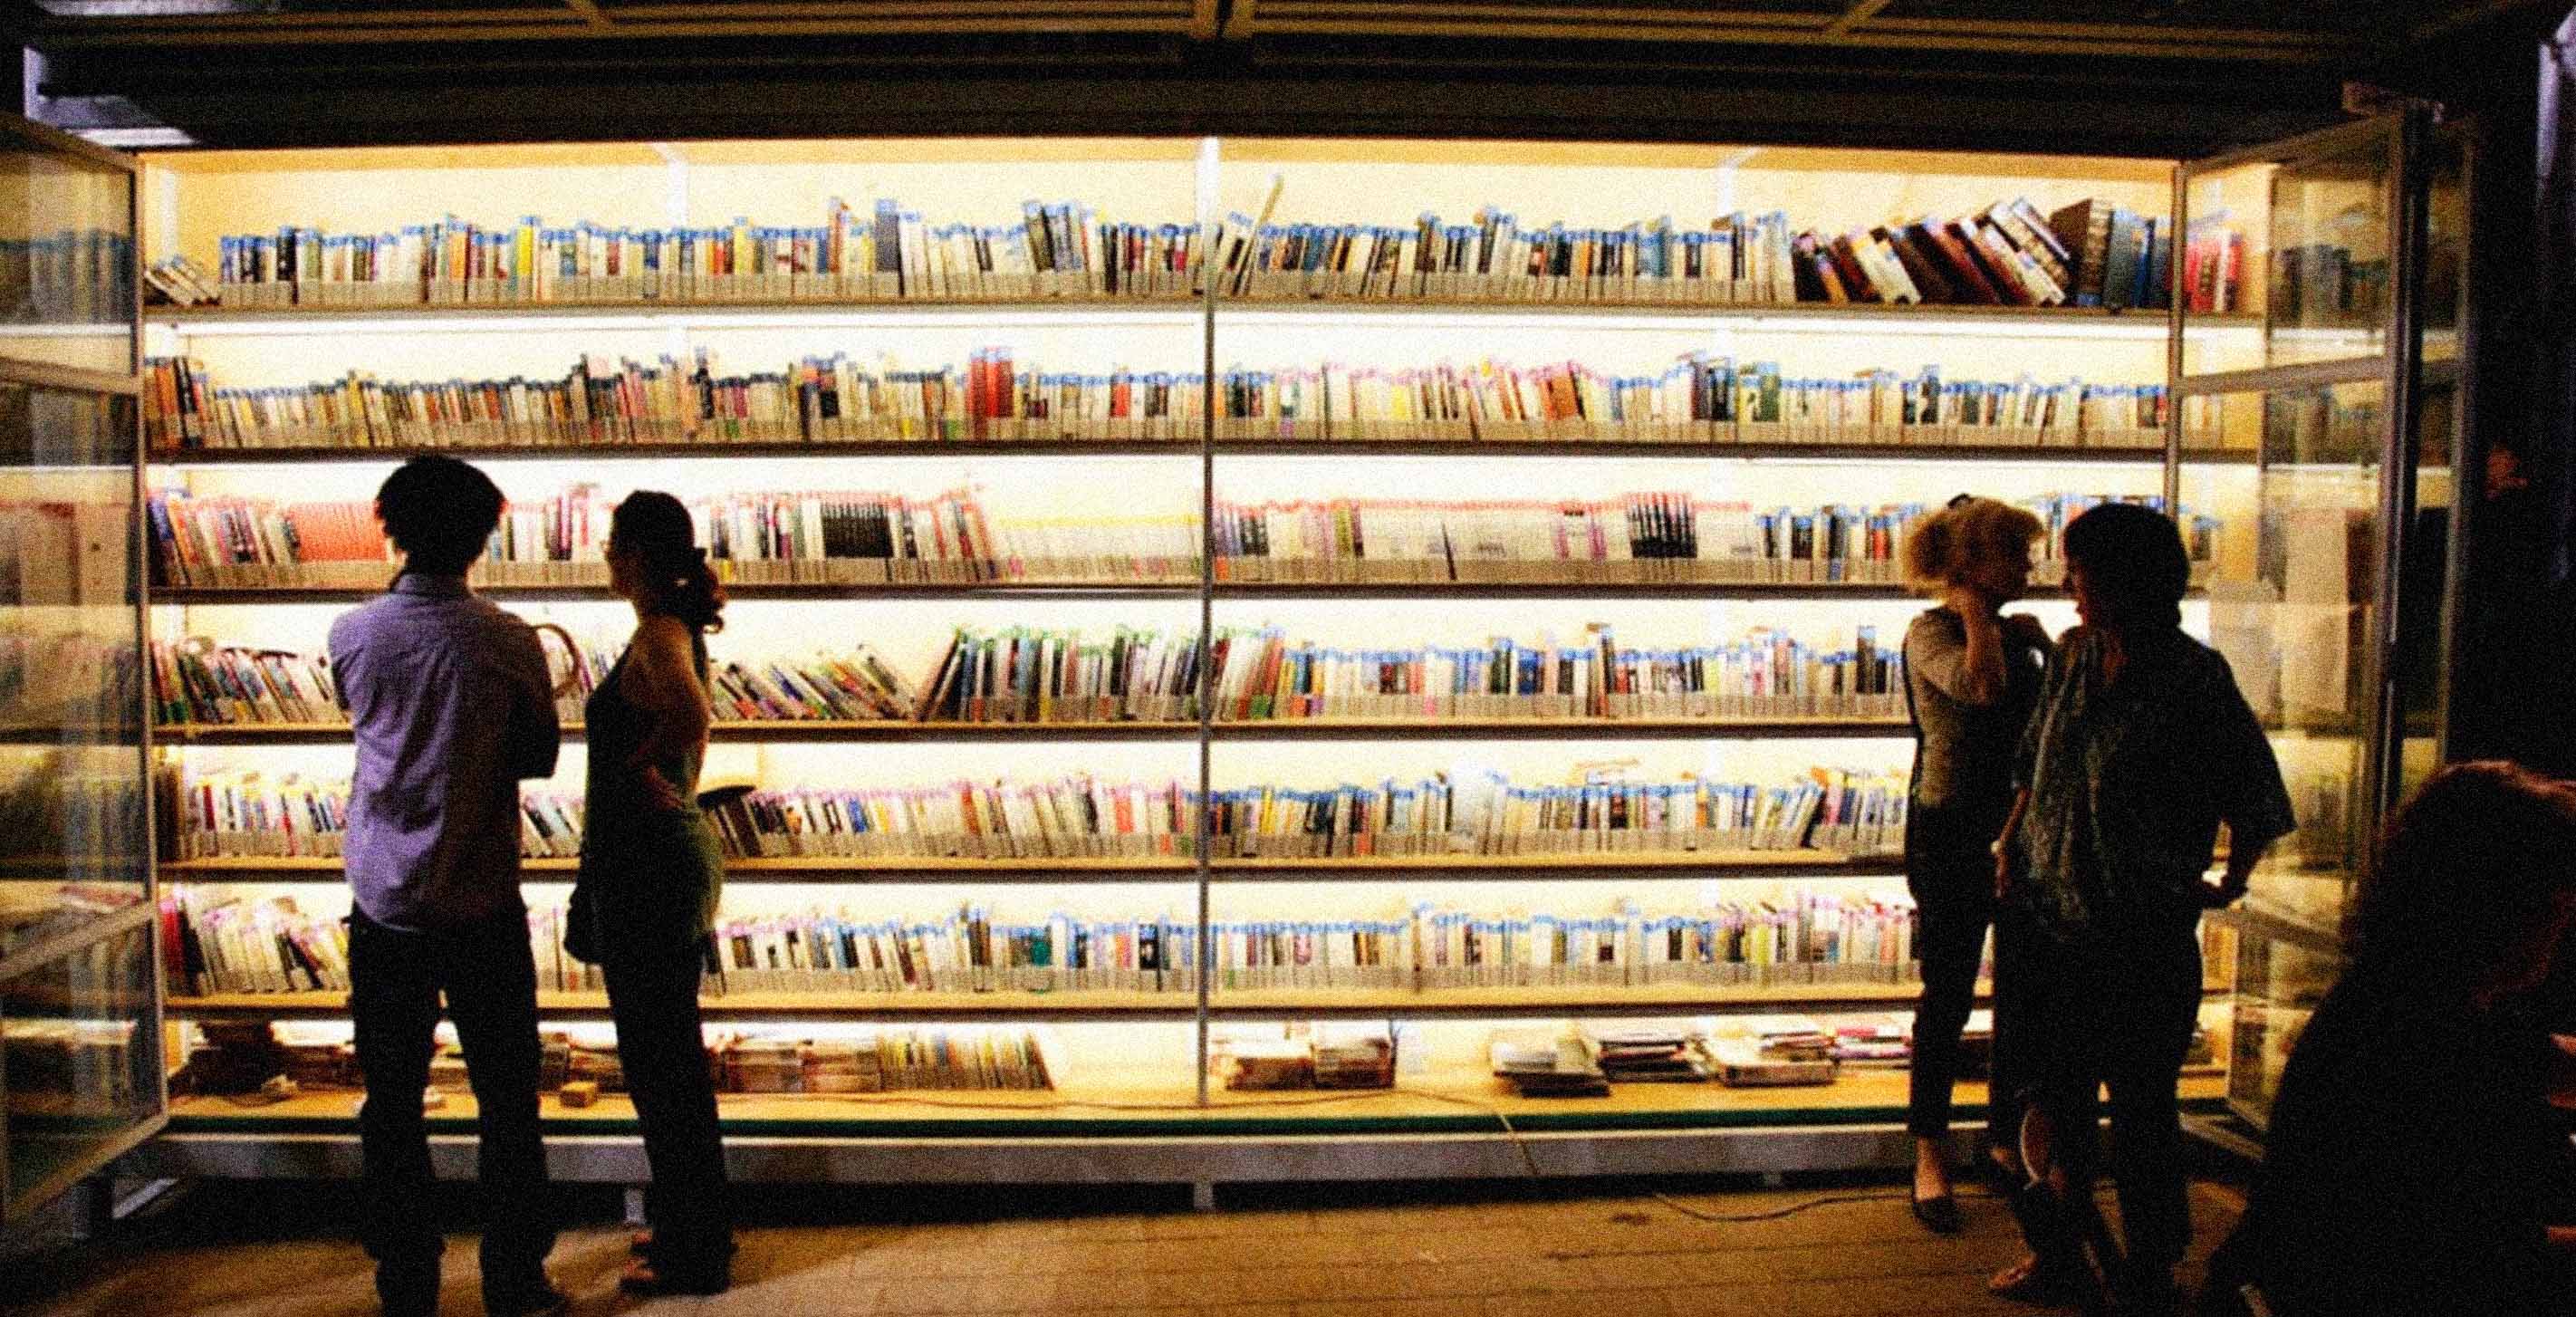
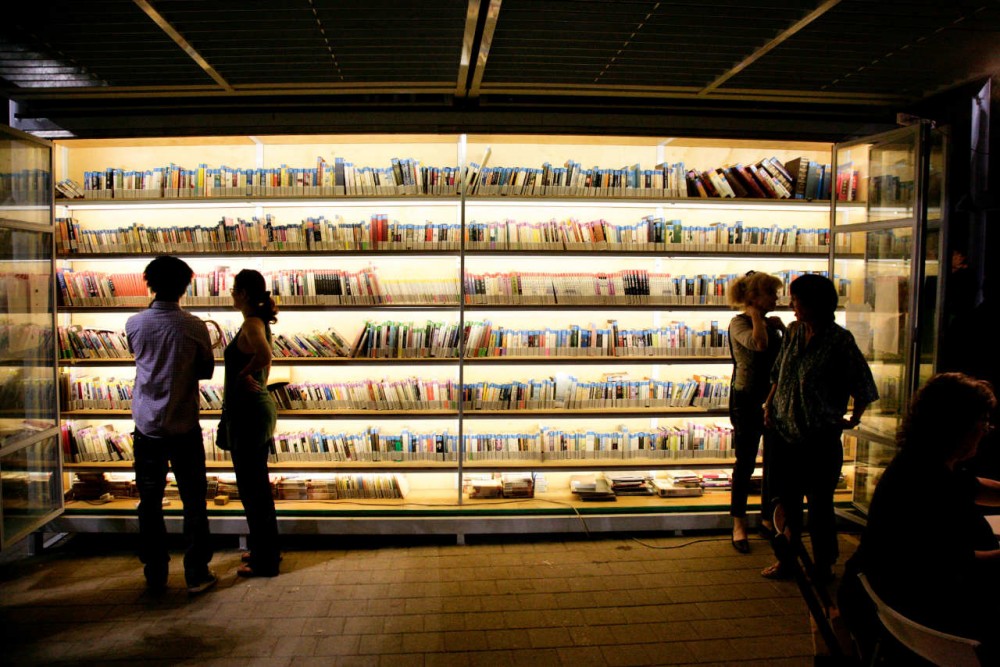
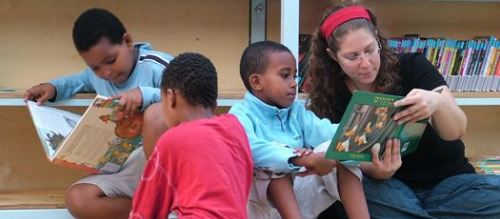
I was interested in participating in this project for a couple of reasons. The first reason is the social relevance of the library itself. The Garden Library was founded in 2009 by ARTEAM, an interdisciplinary art collective whose members are Hadas Ophrat, Romy Achituv, Marit Benisrael, Tali Tamir, Nimrod Ram, and Yoav Meiri. It is an outdoor library with no guards, walls, or door, and it serves the refugees and migrant workers of Tel-Aviv. Designed by Yoav Meiri in collaboration with the other ARTEAM members, it is located in a park near the central bus station, where migrant workers congregate on weekends, and is comprised of two wall bookcases, one with books for adult readers and the other with children's books. A permanent canopy between the bookshelves creates a shelter for browsing, reading, and socializing. The library currently contains approximately 3,500 books in Amharic, Arabic, Thai, Bengali, English, French, Hebrew, Hindi, Nepali, Russian, Spanish, Tagalog, Thai, Tigrinya, and Turkish. In a challenging time for the migrant communities in Israel, the Garden Library provides a space for expression and identity.
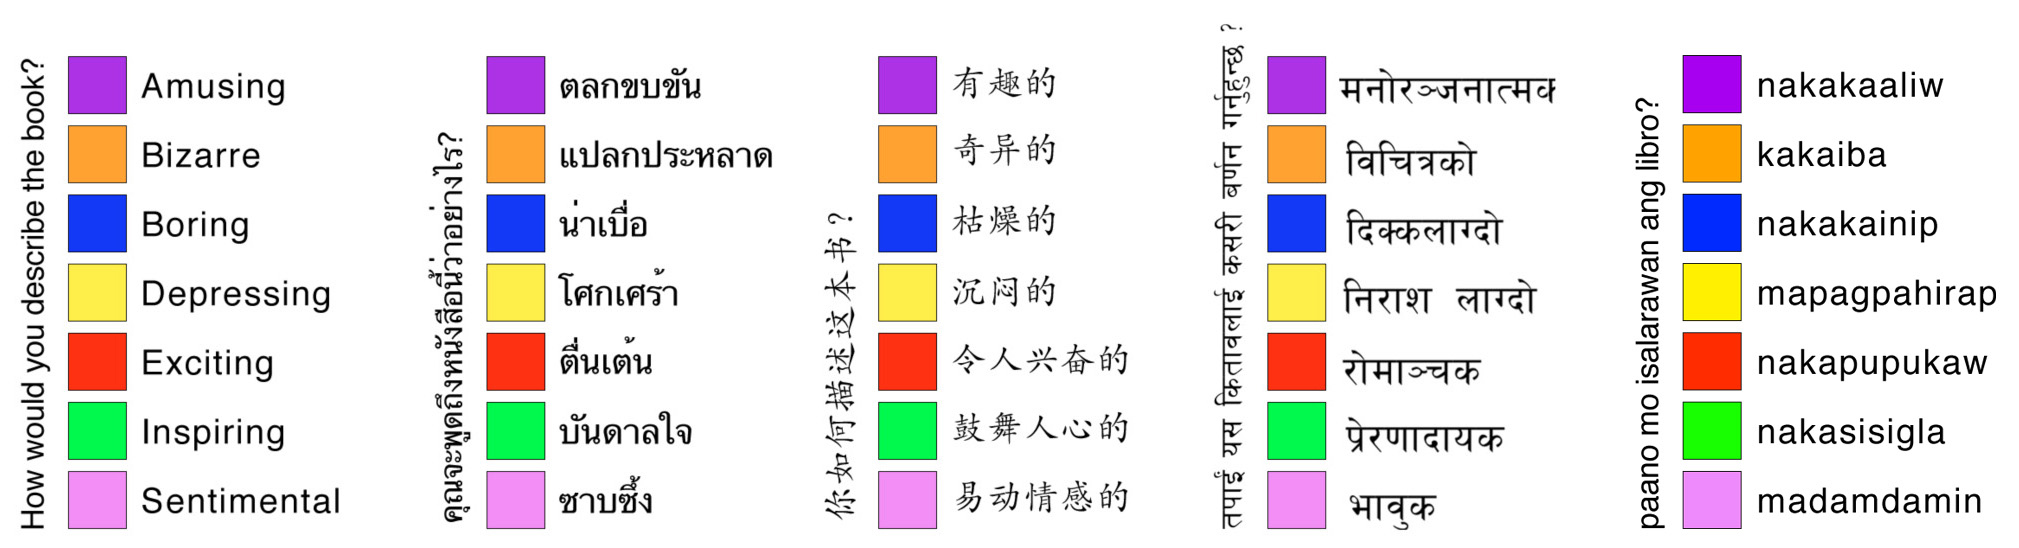
The second reason that made this project very interesting to me is the classification system used to index the books. As previously mentioned, the Garden Library has a unique emotion-based system where readers rate the books according to seven emotional categories: amusing, bizarre, boring, depressing, exciting, inspiring, and sentimental. Every time a book is returned to the shelves, the emotional judgment assigned by the last reader is added to the growing emotional history of the book. ARTEAM's goal with this system is to give the readers the possibility to determine the organization of the library in a more open and playful way. As Marit Benisrael put it: “The idea is that the books will wander in the library like people do in the world, and that every person can change something.”
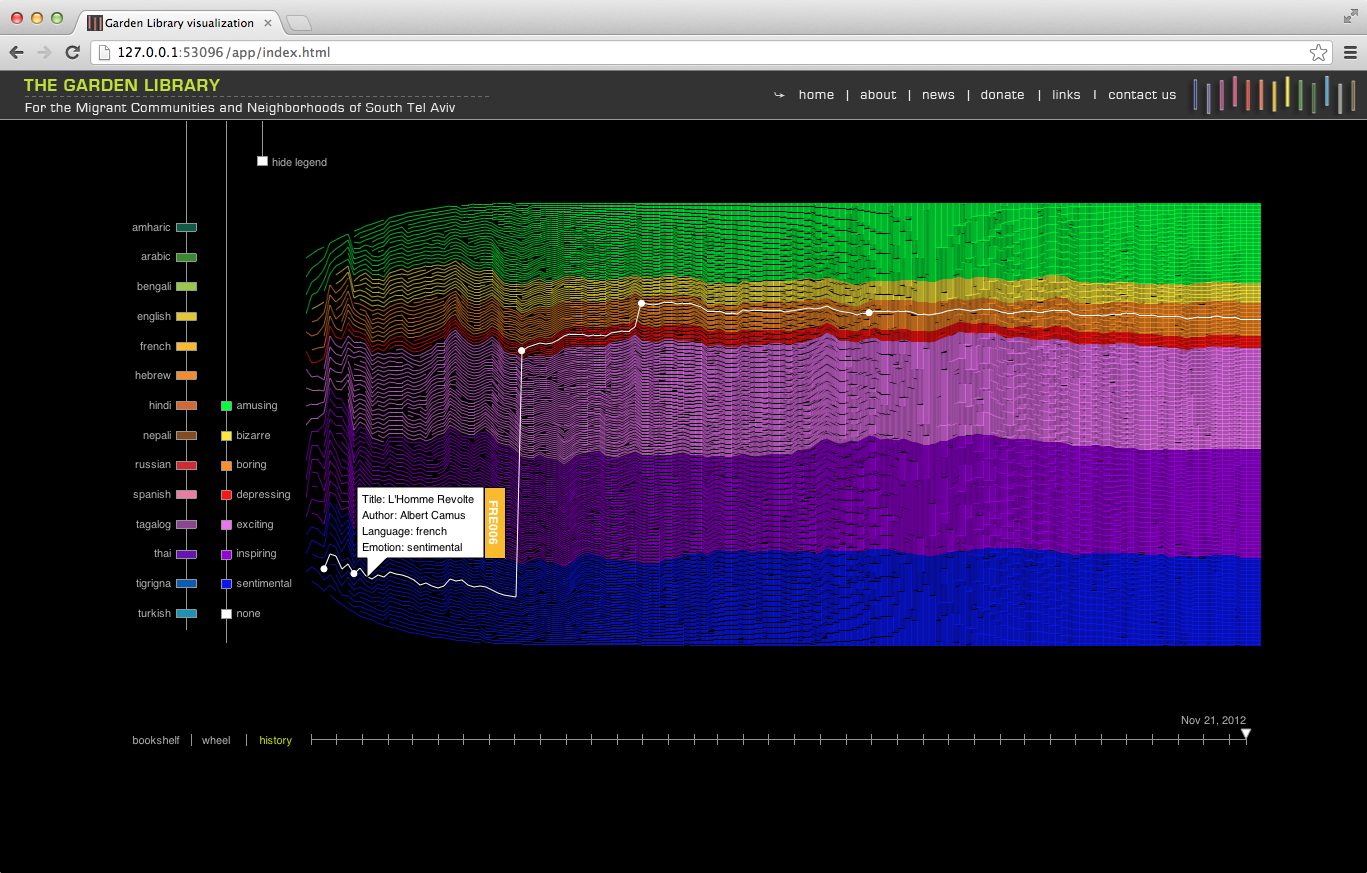
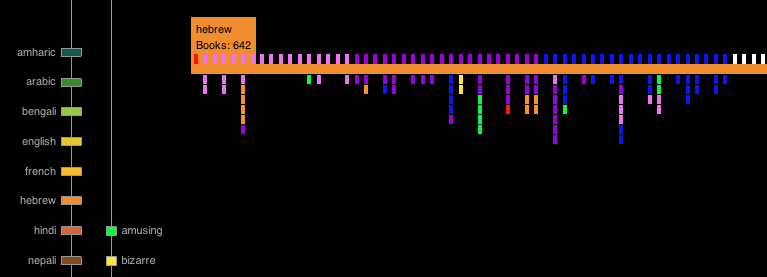
With this background in mind, the visualization aims to function as a tool for exploring the contents of the library, as well as a documentation of its evolution, ultimately determined by the changes in the migrant community itself. The multiple roles that the visualization needed to play prompted us to create different representations of the same book data. The visualization currently includes three views that cover various degrees of abstraction and function: bookshelf view, wheel view, and history view.
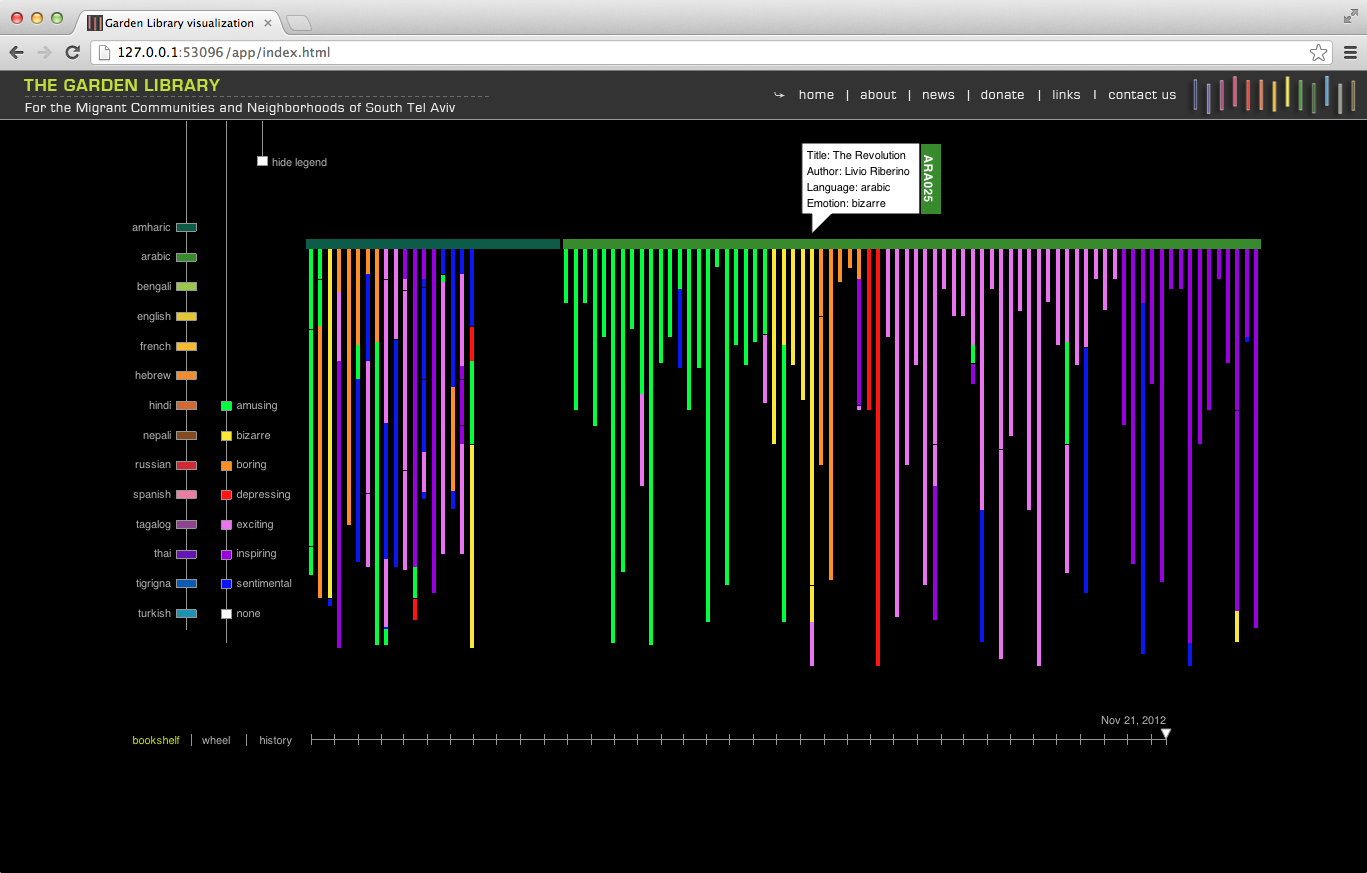
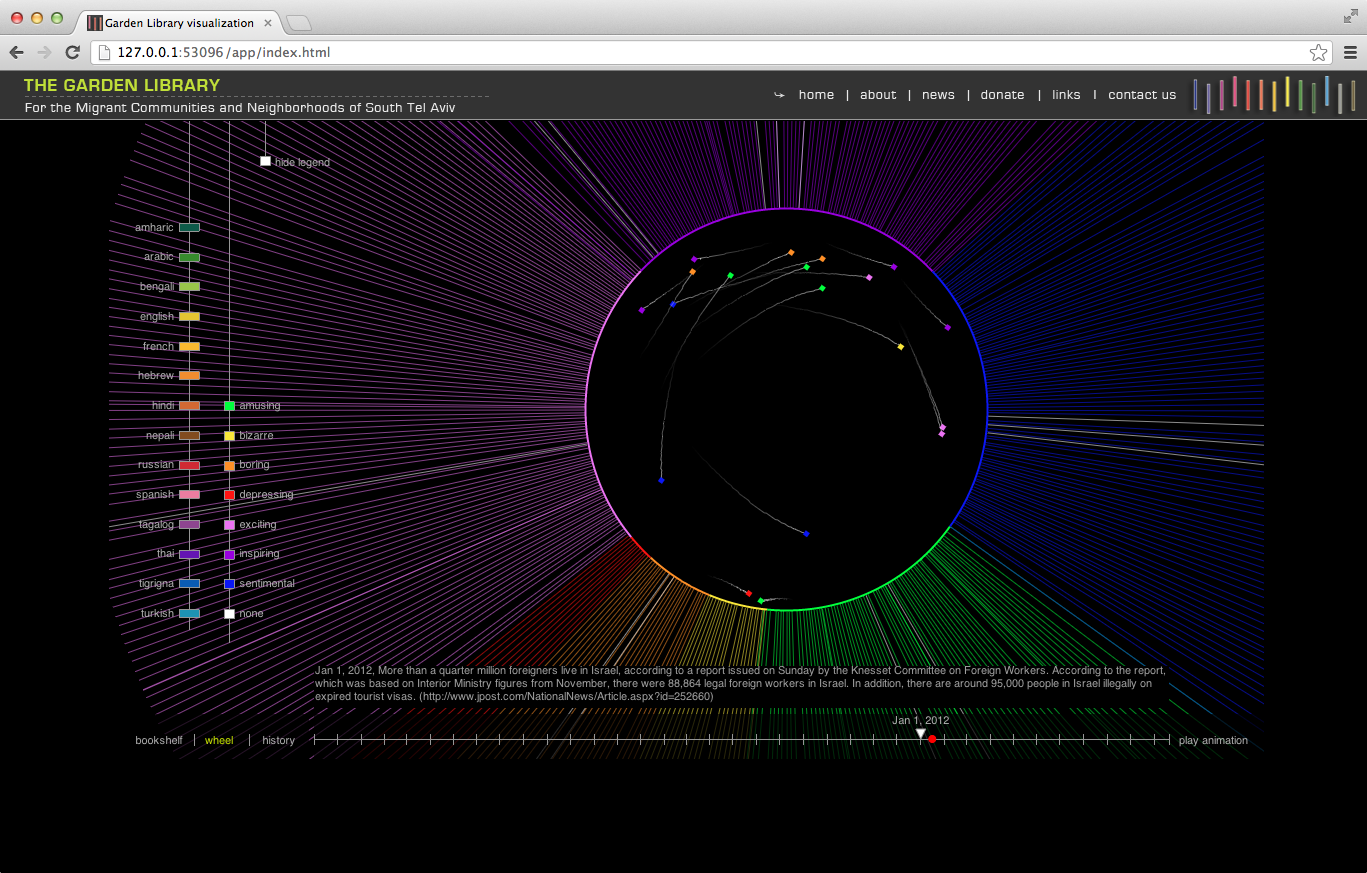
The bookshelf and wheel views have different levels of zooming that allow the visitors to get a panoramic glimpse of the entire data, and then focus on specific subsets of it.
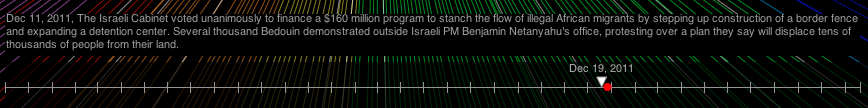
As a way to make the link between the emotional history of the books and the current events affecting the migrant communities more explicit, the timeline displays a popup containing news that occurred near the selected time point:
A central element in all these views is the dynamic nature of the emotional judgments, and how they respond to local events and changes and shifts in the migrant communities that use the library. As Romy Achituv described it:
The history of the emotional judgments will permit dynamic illustration of “wandering maps,” displaying the relative placements of the books at any point in time and the dynamic changes over time. The visual mapping is intended to familiarize site visitors with the library’s reader communities, their opinions and preferences.
We’d love to hear what you’re working on, what you’re curious about, and what messy data problems we can help you solve. Drop us a line at hello@fathom.info, or you can subscribe to our newsletter for updates.