In recent years, software defined radio (SDR) has become a popular pastime among a small but enthusiastic community of hobbyists. SDRs are radios enmeshed with computers. Software that runs on a standard personal computer can replace parts of the radio that we typically think of as physical objects with wires and knobs—like amplifiers, filters and so on.
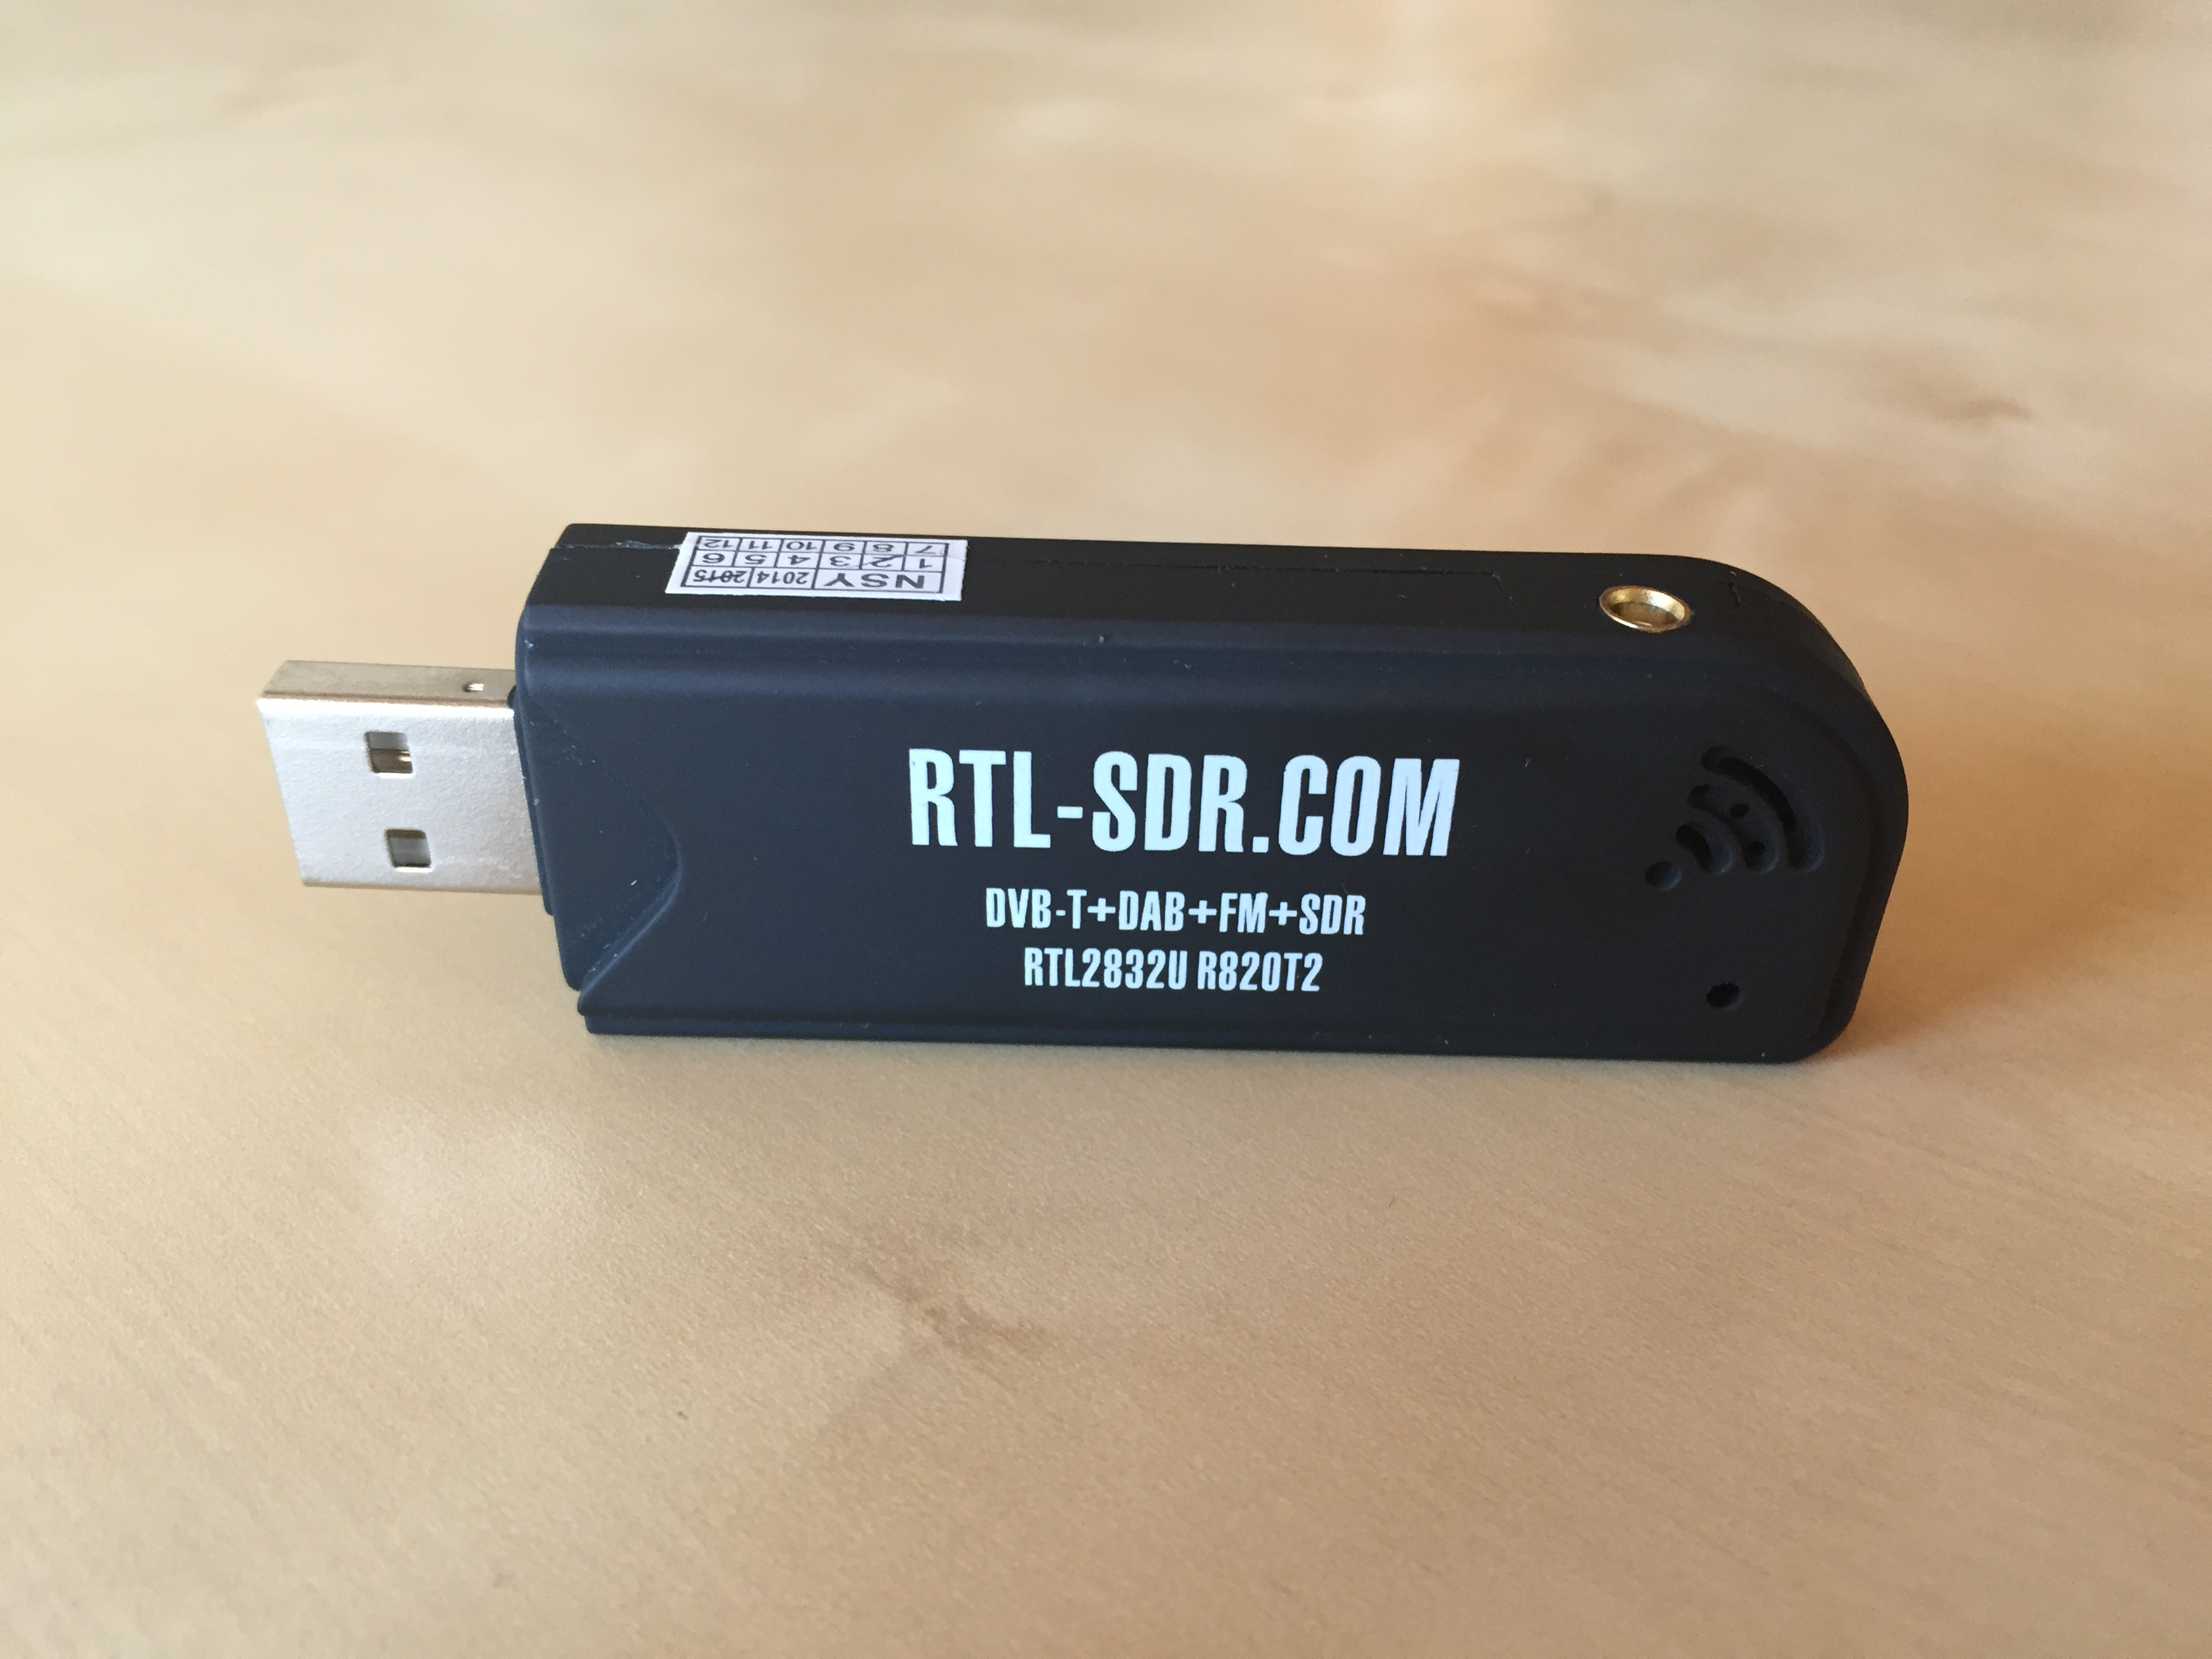
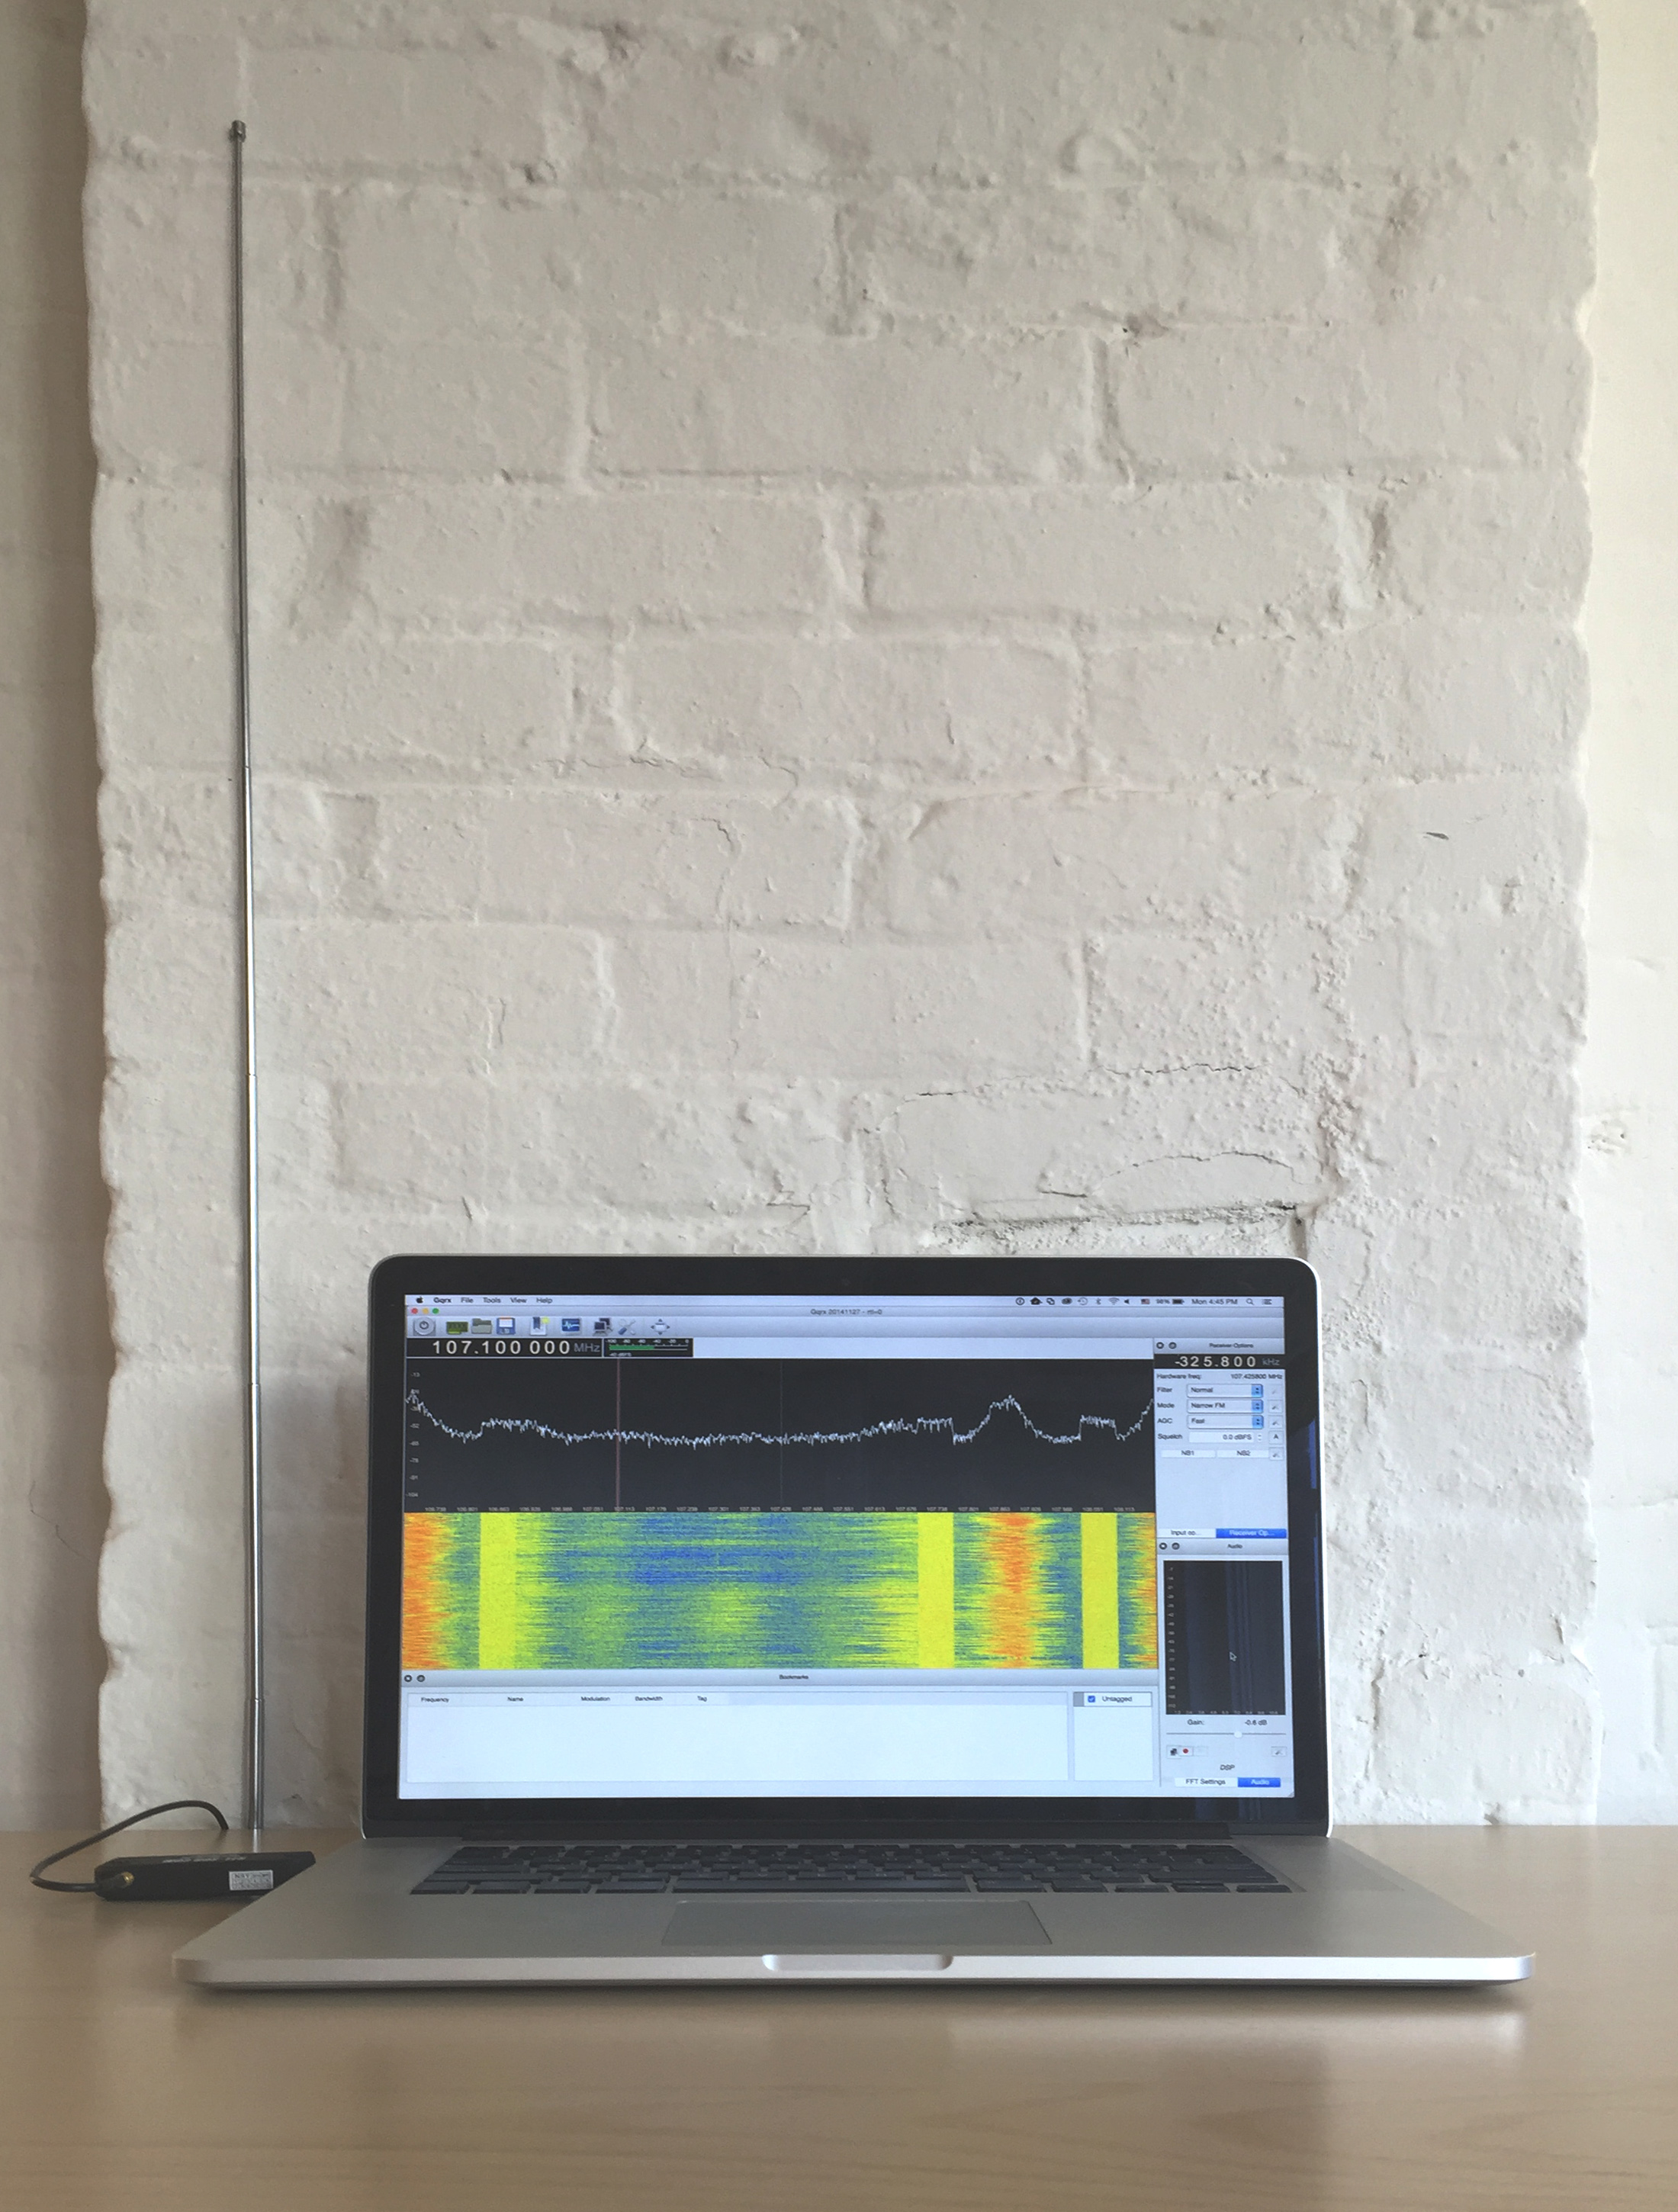
Integration with the computer makes SDRs extremely versatile. They can be applied to a variety of projects, such as building a simple FM tuner, receiving broadcasts from satellites, and even DIY radio astronomy. Best of all, they’re cheap! So we purchased an SDR kit for the office, opting for the extra large whip antenna, and took it for a spin.
SDRs are relatively new and still a niche interest, so the available software is predominantly developed by the user community. Several applications are available for specialized purposes, but it seems the largest platform for developing custom tools is GNU Radio.
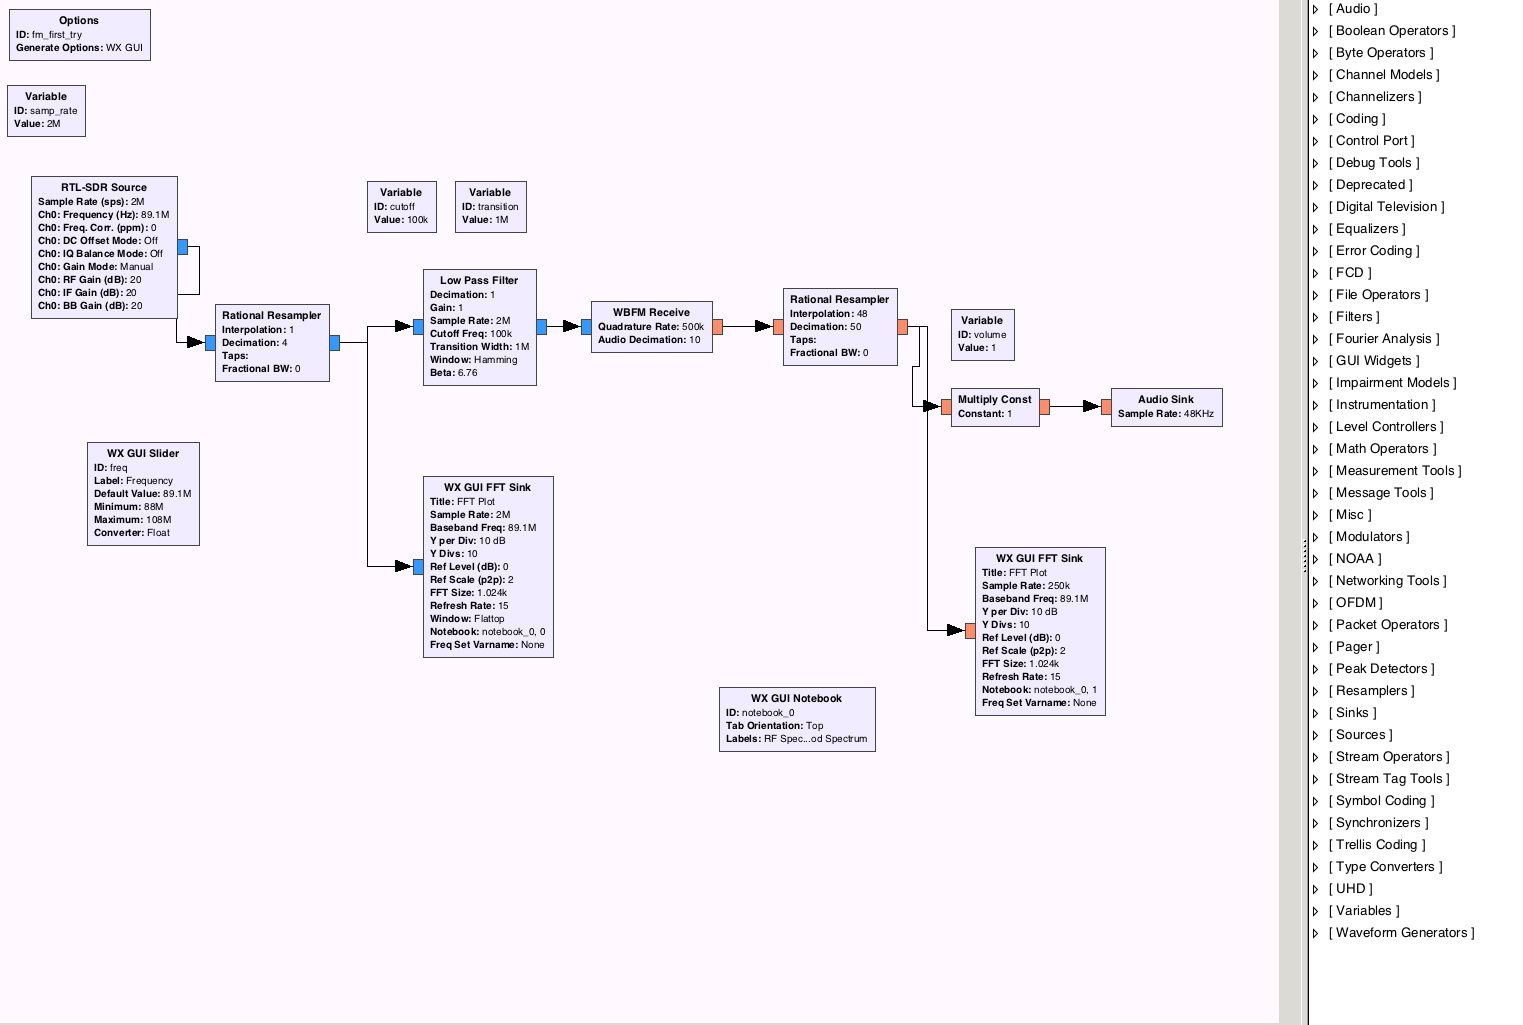
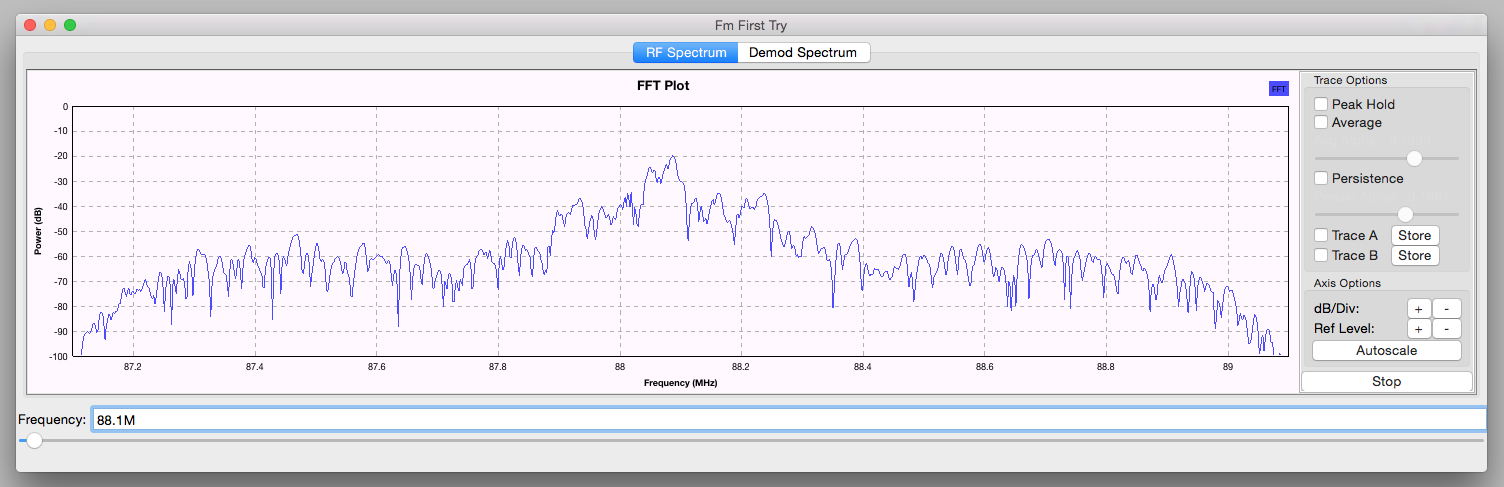
GNU Radio offers a collection of software blocks written in C++ that handle low-level functions like signal processing. It's packaged in Python for a convenient and approachable API. With GNU Radio, applications can quickly be written in Python, or using the convenient node-based visual development environment in the GNU Radio Companion.
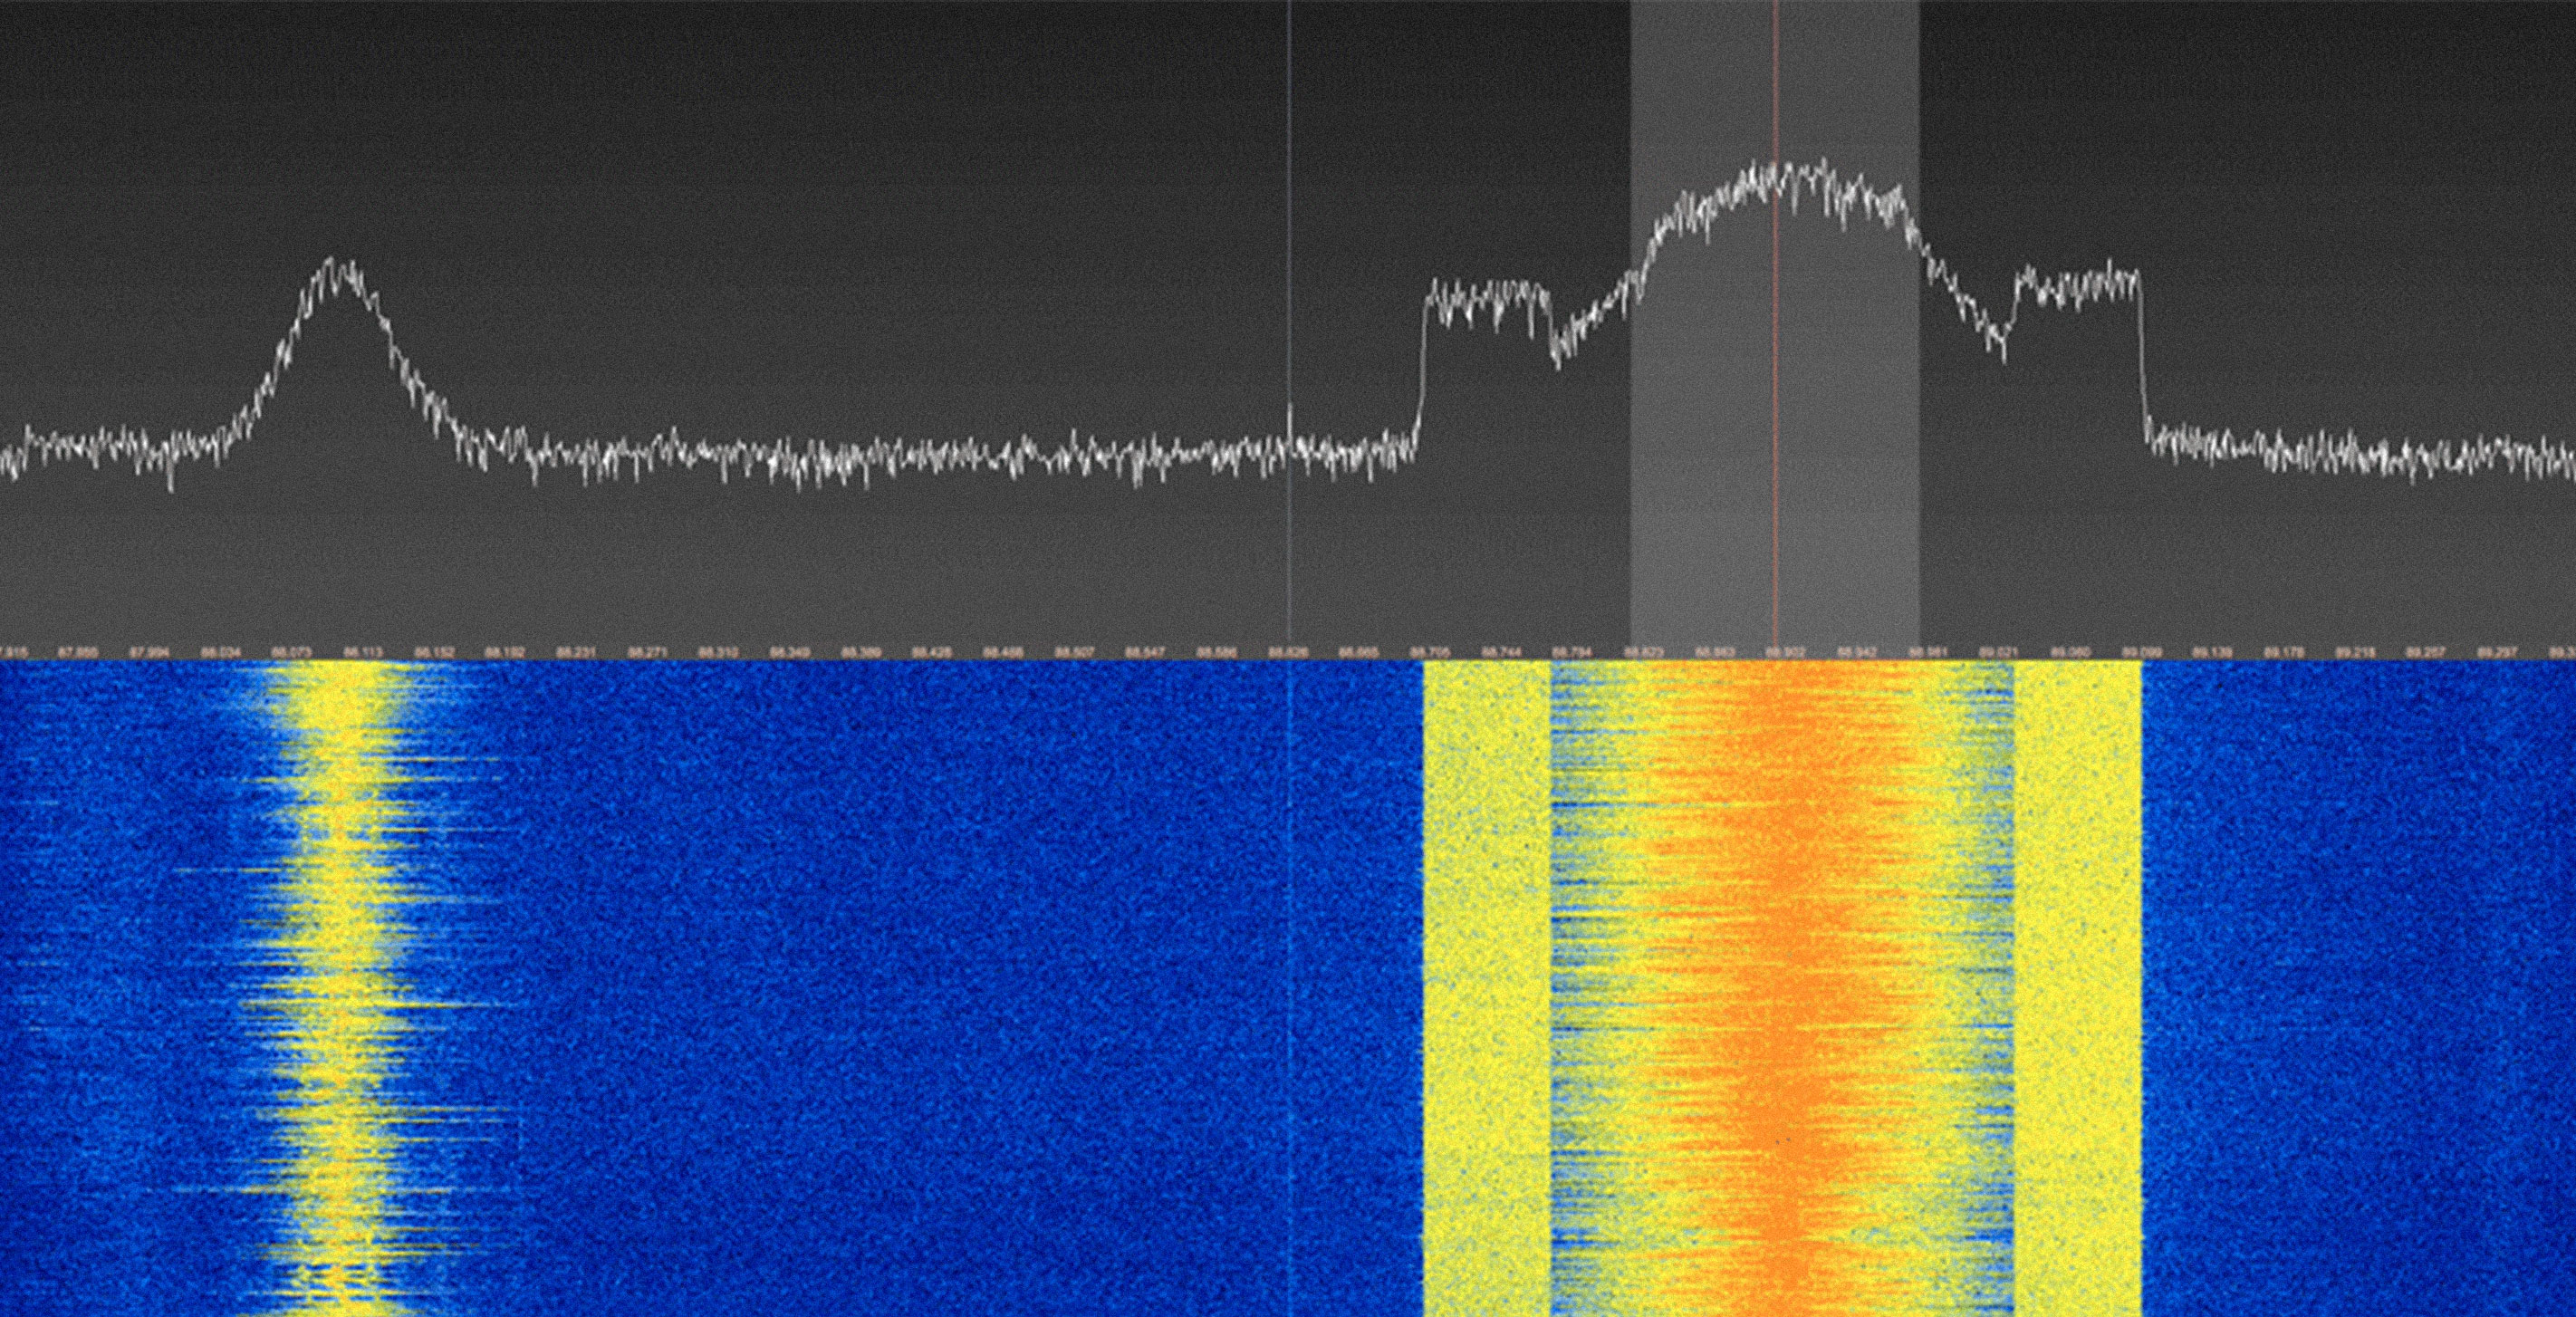
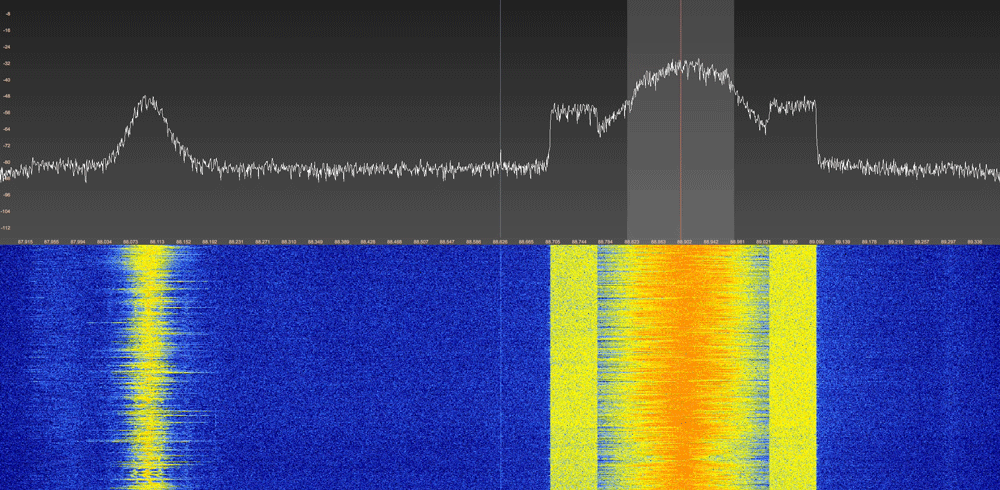
Of course, dedicated members of the SDR community have written much more sophisticated applications. One of them is GQRX, a free and open source project built on the GNU Radio platform. Its basic workflow features a precise tuner augmented by visualizations of real-time activity on the radio spectrum. As with any radio, users can only listen to one frequency at a time, but a Fourier transform graph shows activity across the entire bandwidth of the range the radio is receiving. Simultaneously, a waterfall graph ticks along below it, showing broadcast strength at each frequency over time. Aside from the geeky coolness factor, this is also a great application of visual design to a technical challenge. The visualizations let users examine a broad range of frequencies at a glance to find active stations, rather than having to blindly try each frequency one at a time. The program is immensely useful when exploring frequencies outside the well-known commercial radio range.
While we were considering other SDR projects to try, we discovered that it is possible to download imagery from NOAA weather satellites as they pass by. We've been doing quite a bit of cartography lately (see No Ceilings, All Streets, Urban Agriculture) so this seems like a natural next step, and we hope to have some weather maps ready to share soon!
People may not be listening to music on the radio as much as they once did, but our electronic devices are constantly “on the air,” transmitting and receiving data via radio waves to keep us connected. One reason why we are interested in SDR is because it lets people peek into those layers of data, which would otherwise be inaccessible. And making the inaccessible accessible—or the invisible visible—is the goal of data visualization.
So don’t touch that dial! We’ll be back with more after the break.
We’d love to hear what you’re working on, what you’re curious about, and what messy data problems we can help you solve. Drop us a line at hello@fathom.info, or you can subscribe to our newsletter for updates.